Chrome Internal Pages: Full chrome:// List (Tested 154)
Chrome internal pages are the chrome:// URLs that expose Chrome's settings, diagnostics and debug tools. To see the full list, type chrome://chrome-urls (or chrome://about, which redirects there) into the address bar. In Chrome 154 that page lists 199 entries, but only a couple of dozen are worth knowing — and a handful will crash your browser if you open them.
I did not want to repeat the usual copy-pasted list, so I enumerated chrome://chrome-urls on Chrome 154.0.8037.93 (macOS, October 2026) and opened every single page in a tab through the DevTools Protocol, recording whether it rendered, errored or took the browser down. This post is the result: the real count, a curated table of the useful ones with who each is for, and the ones that no longer exist.
The Master List: chrome://chrome-urls
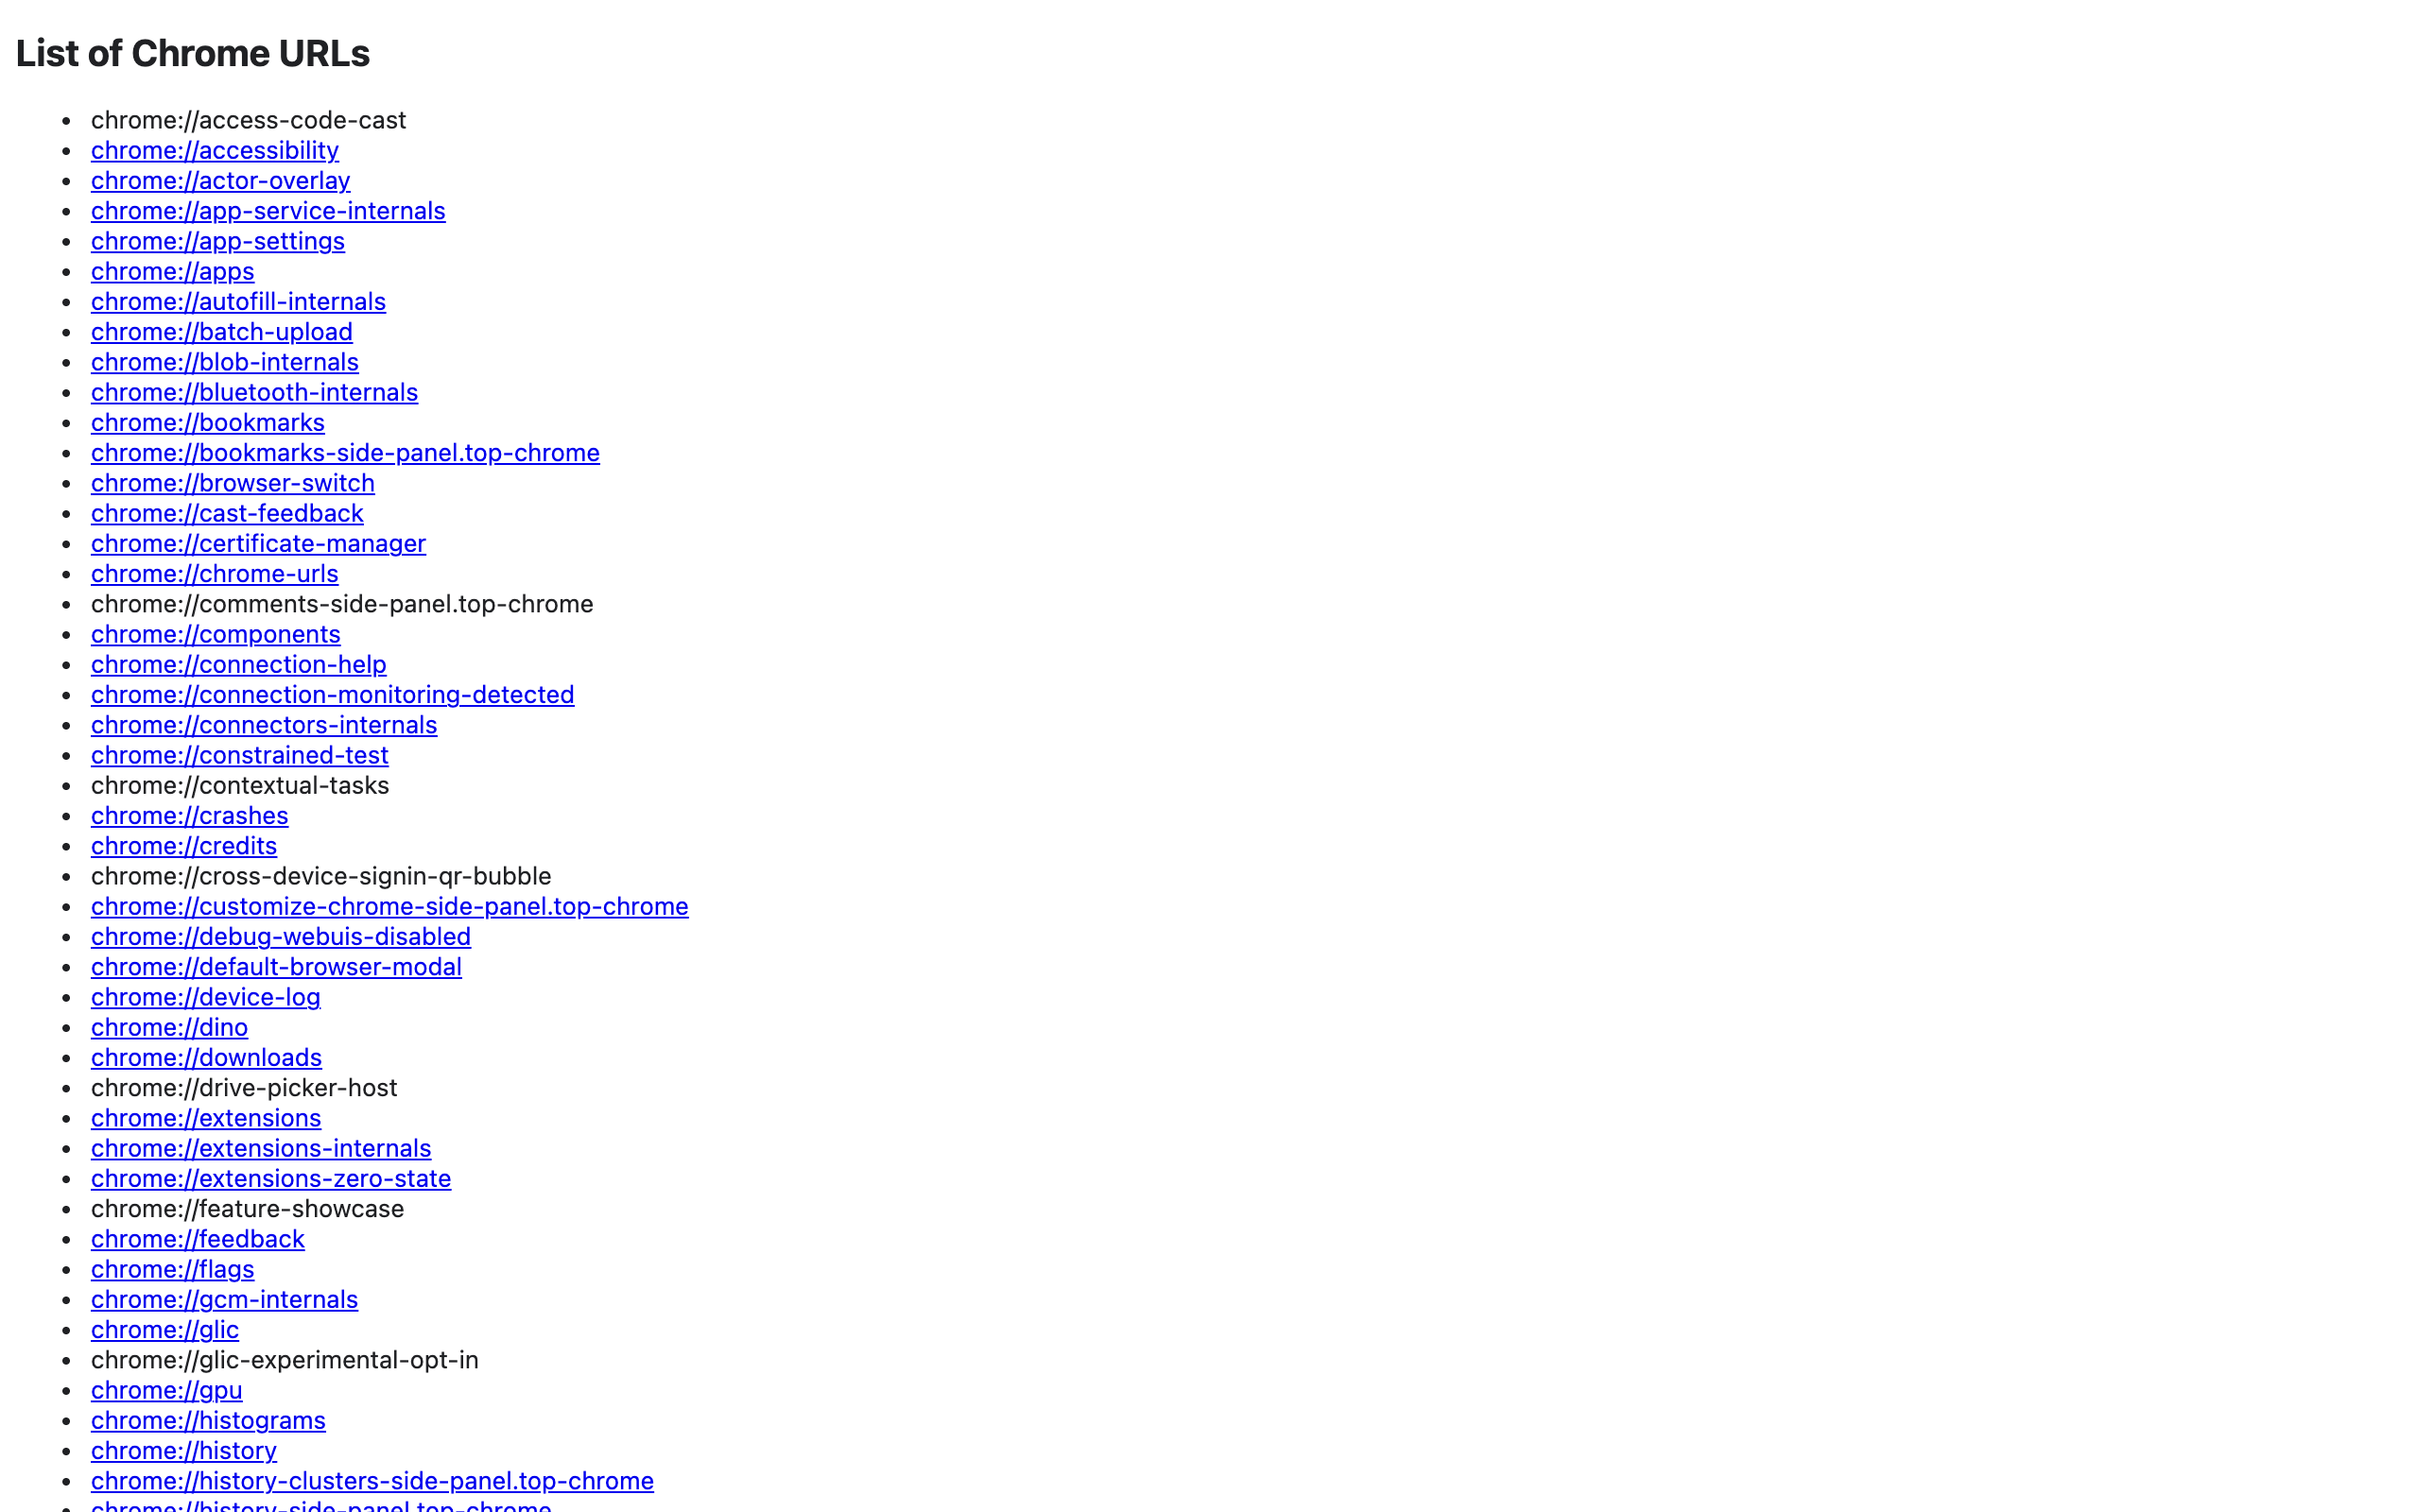
The page has three sections, and the counts matter because they tell you how much of Chrome is hidden:
| Section | Entries in Chrome 154 | Notes |
|---|---|---|
| List of Chrome URLs | 128 (118 chrome:// + 10 chrome-untrusted://) | 108 are clickable links; 20 are plain text |
| Internal Debugging Page URLs | 40 | Disabled by default — see below |
| Command URLs for Debug | 31 | Not linked on purpose: they crash or hang Chrome |
| Total | 199 (167 unique pages + 31 commands) | chrome://profile-internals appears in two sections |
The plain-text entries are telling. When I opened them, 14 of the 15 unlinked chrome:// entries returned ERR_INVALID_URL — they exist in the code but are not enabled in this build. The one exception, chrome://newtab, simply redirects to chrome://new-tab-page. If a page is not a link on chrome://chrome-urls, assume it will not load.
Hidden Behind a Switch: Internal Debugging Pages
The second section is the one most lists miss. By default it says "Internal debugging pages are currently disabled", and 40 pages — including old favourites like chrome://discards and chrome://tracing — are greyed out. Try to open chrome://discards directly and Chrome redirects you to chrome://debug-webuis-disabled/?host=chrome://discards/.
To turn them on, open chrome://chrome-urls, scroll to Internal Debugging Page URLs and click Enable internal debugging pages. In my test the links appeared immediately (the link count went from 108 to 144) and the setting survived a browser restart. Click the same button to switch them off again.
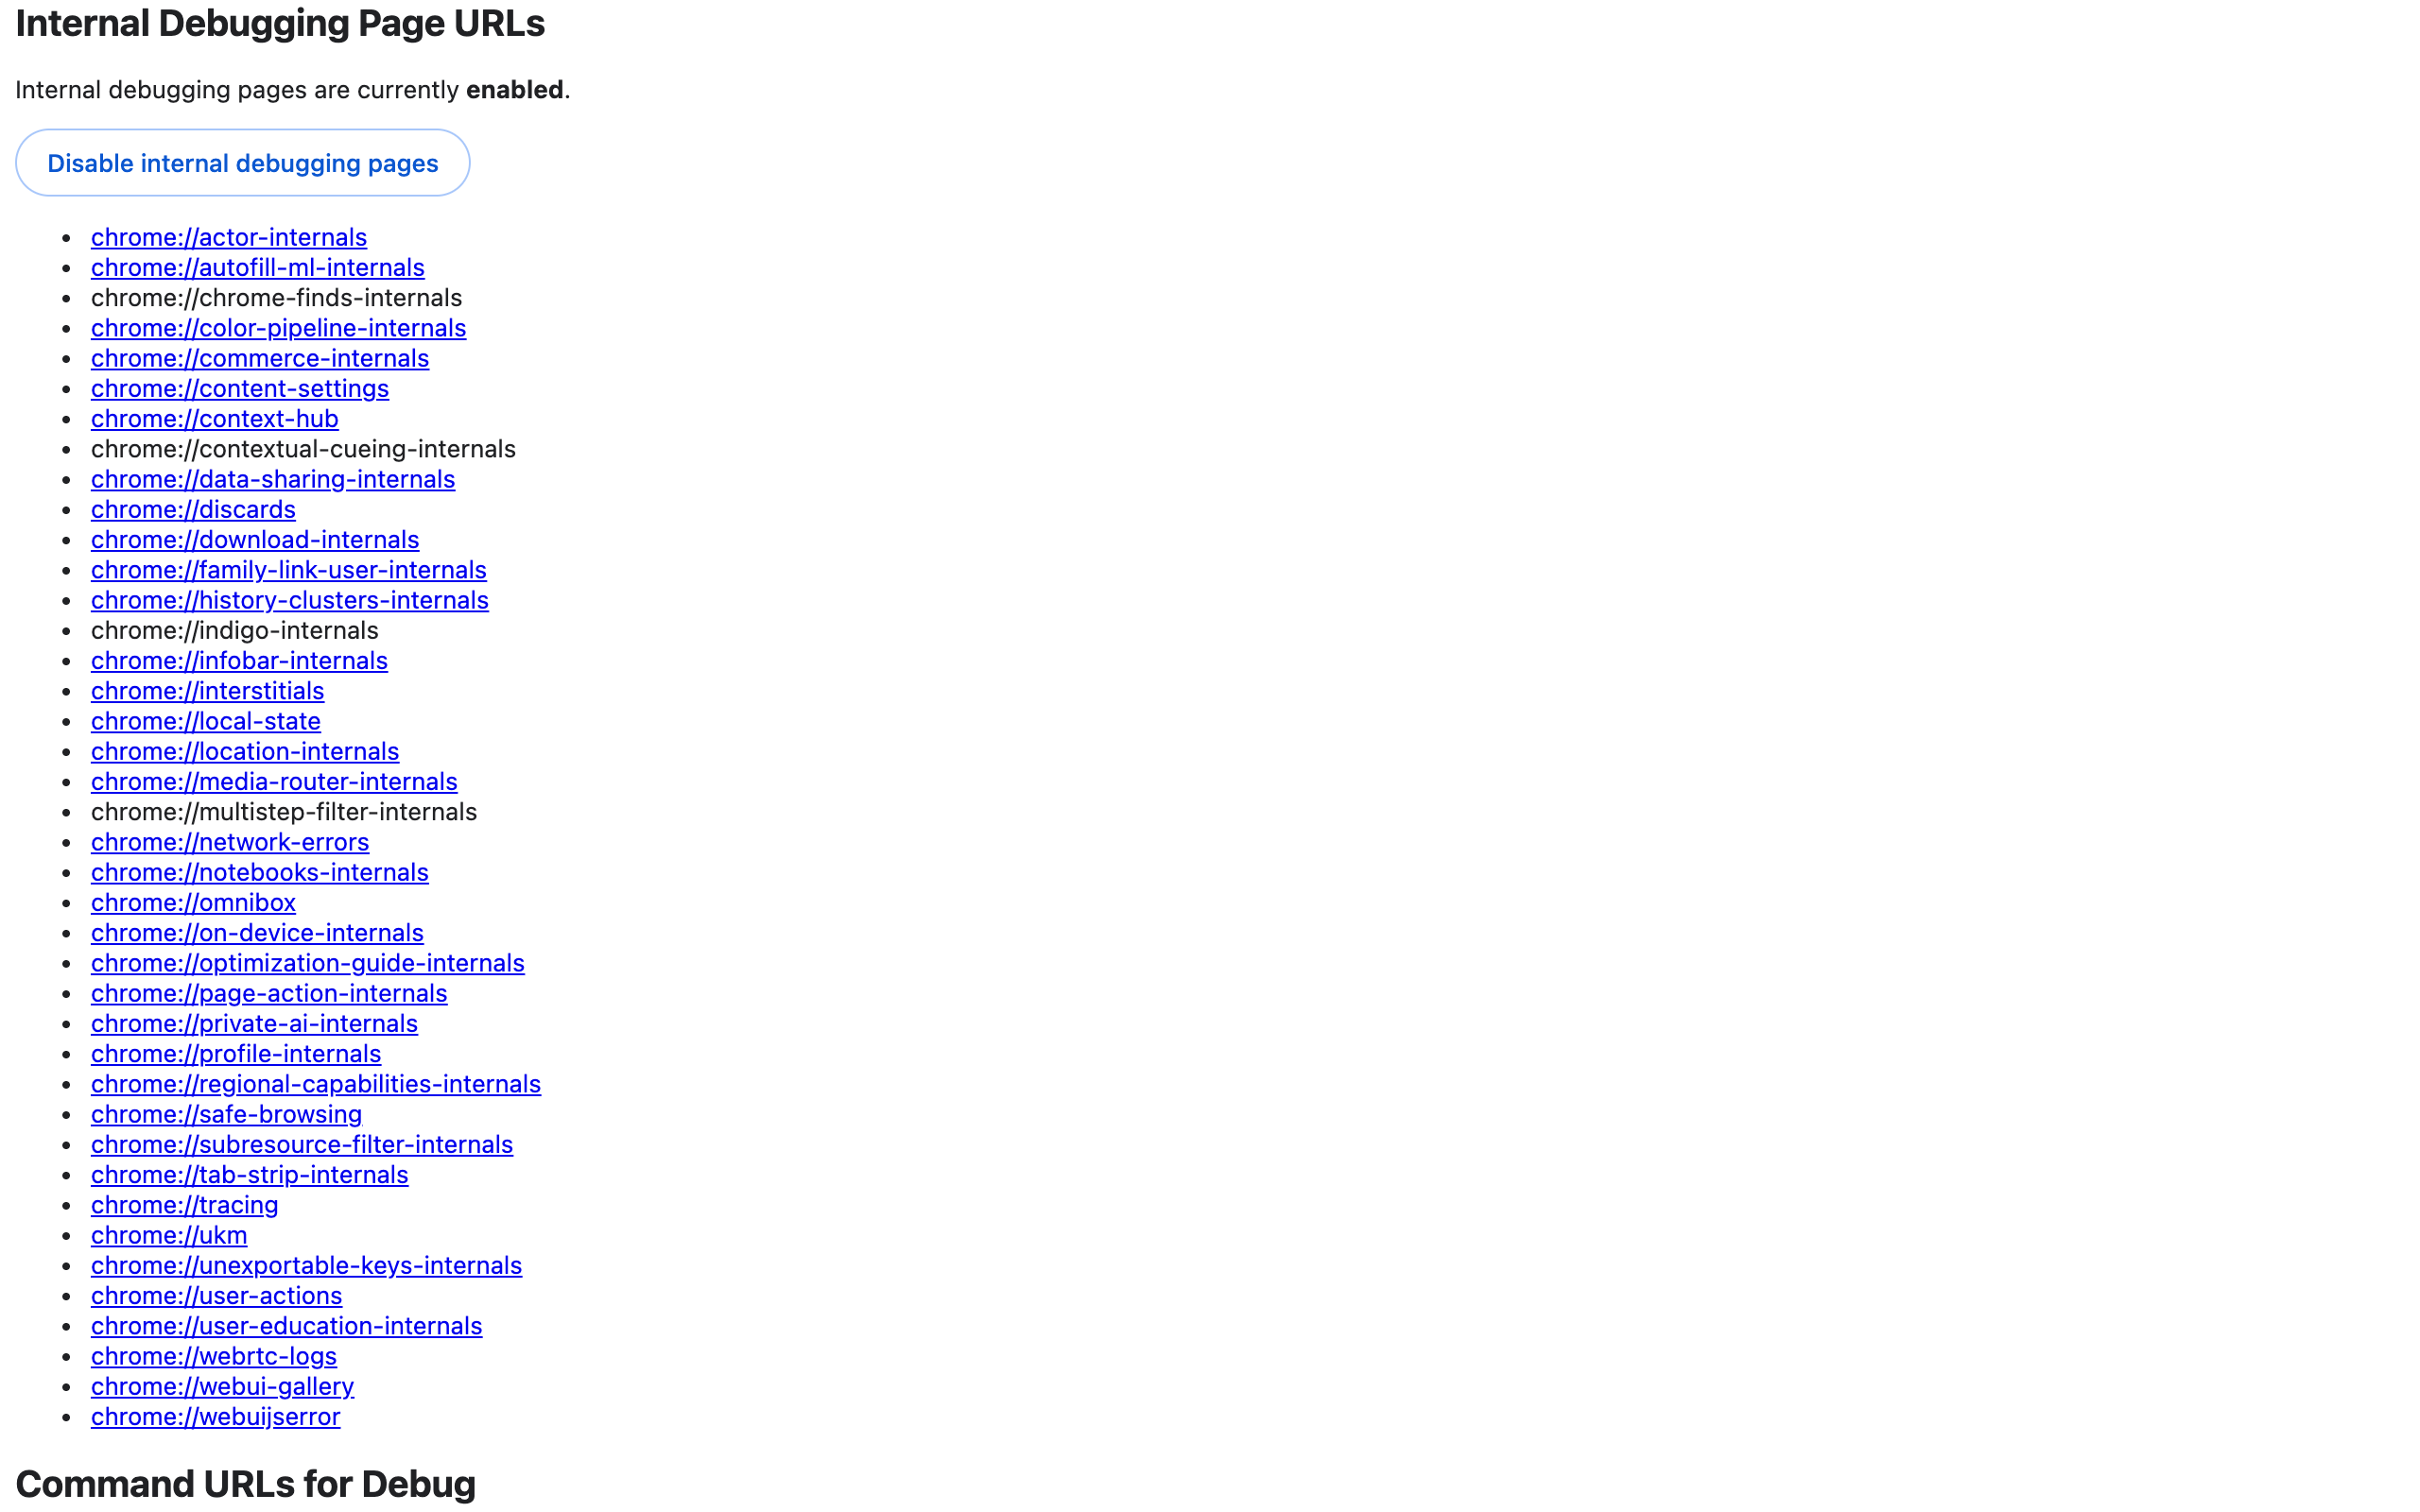
Of the 40, 36 opened once enabled. The four that did not (chrome-finds-internals, contextual-cueing-internals, indigo-internals, multistep-filter-internals) are the ones shown as plain text even after enabling.
What Actually Loads: Test Results for All 157 Pages
Counting every unique chrome:// page from both lists (the 10 chrome-untrusted:// entries are frames for features like Lens and Gemini, not pages you can open directly):
| Result in a normal tab | Pages | Examples |
|---|---|---|
| Rendered | 133 | chrome://version, chrome://gpu, chrome://discards |
ERR_INVALID_URL (listed but not enabled) | 20 | chrome://iwa-dev, chrome://tab-group-home, chrome://signin-error |
| Blocked | 1 | chrome://app-settings — "app-settings is blocked" |
Prefix only (ERR_FAILED) | 1 | chrome://internals — needs a sub-path |
| Froze or crashed the browser | 2 | chrome://history-sync-optin, chrome://signout-confirmation |
That last row was a surprise. Both are dialog pages that Chrome normally shows inside its own sign-in UI; loaded as a regular tab, one hung my test browser and the other crashed it. Neither is useful on its own, so there is no reason to open them.
Many of the pages that "rendered" are not meant for you either. Anything ending in .top-chrome (chrome://tab-search.top-chrome, chrome://read-later.top-chrome, chrome://omnibox-popup.top-chrome) is a piece of Chrome's own interface — the tab search bubble, the reading list side panel, the address-bar dropdown — and it renders as a lonely fragment when opened in a tab.
The Useful Chrome Internal Pages (Curated Table)
These are the ones I would actually bookmark, verified on Chrome 154. "For whom" is the honest audience — most -internals pages are for Chrome engineers, not users.
| Page | What it does | For whom |
|---|---|---|
chrome://settings | All settings; sub-paths jump straight to a section, e.g. chrome://settings/performance, chrome://settings/content, chrome://settings/clearBrowserData, chrome://settings/ai | Everyone |
chrome://version | Exact version, OS, executable path, profile path, and the command line including active flags | Everyone (support, bug reports) |
chrome://flags | Experimental features | Power users |
chrome://extensions/shortcuts | Set or change keyboard shortcuts for every extension | Power users |
chrome://history, chrome://downloads, chrome://bookmarks | The familiar pages, reachable by URL | Everyone |
chrome://password-manager/checkup | Jumps straight to the compromised/weak password check | Everyone |
chrome://discards | Every tab's lifecycle state, discard count and an "Urgent discard a tab now" link (debug switch required) | Power users with many tabs |
chrome://process-internals | Site isolation and the frame tree: which iframe runs in which process | Developers, curious power users |
chrome://gpu | Hardware acceleration status, GPU driver info, problems detected | Anyone debugging video or rendering glitches |
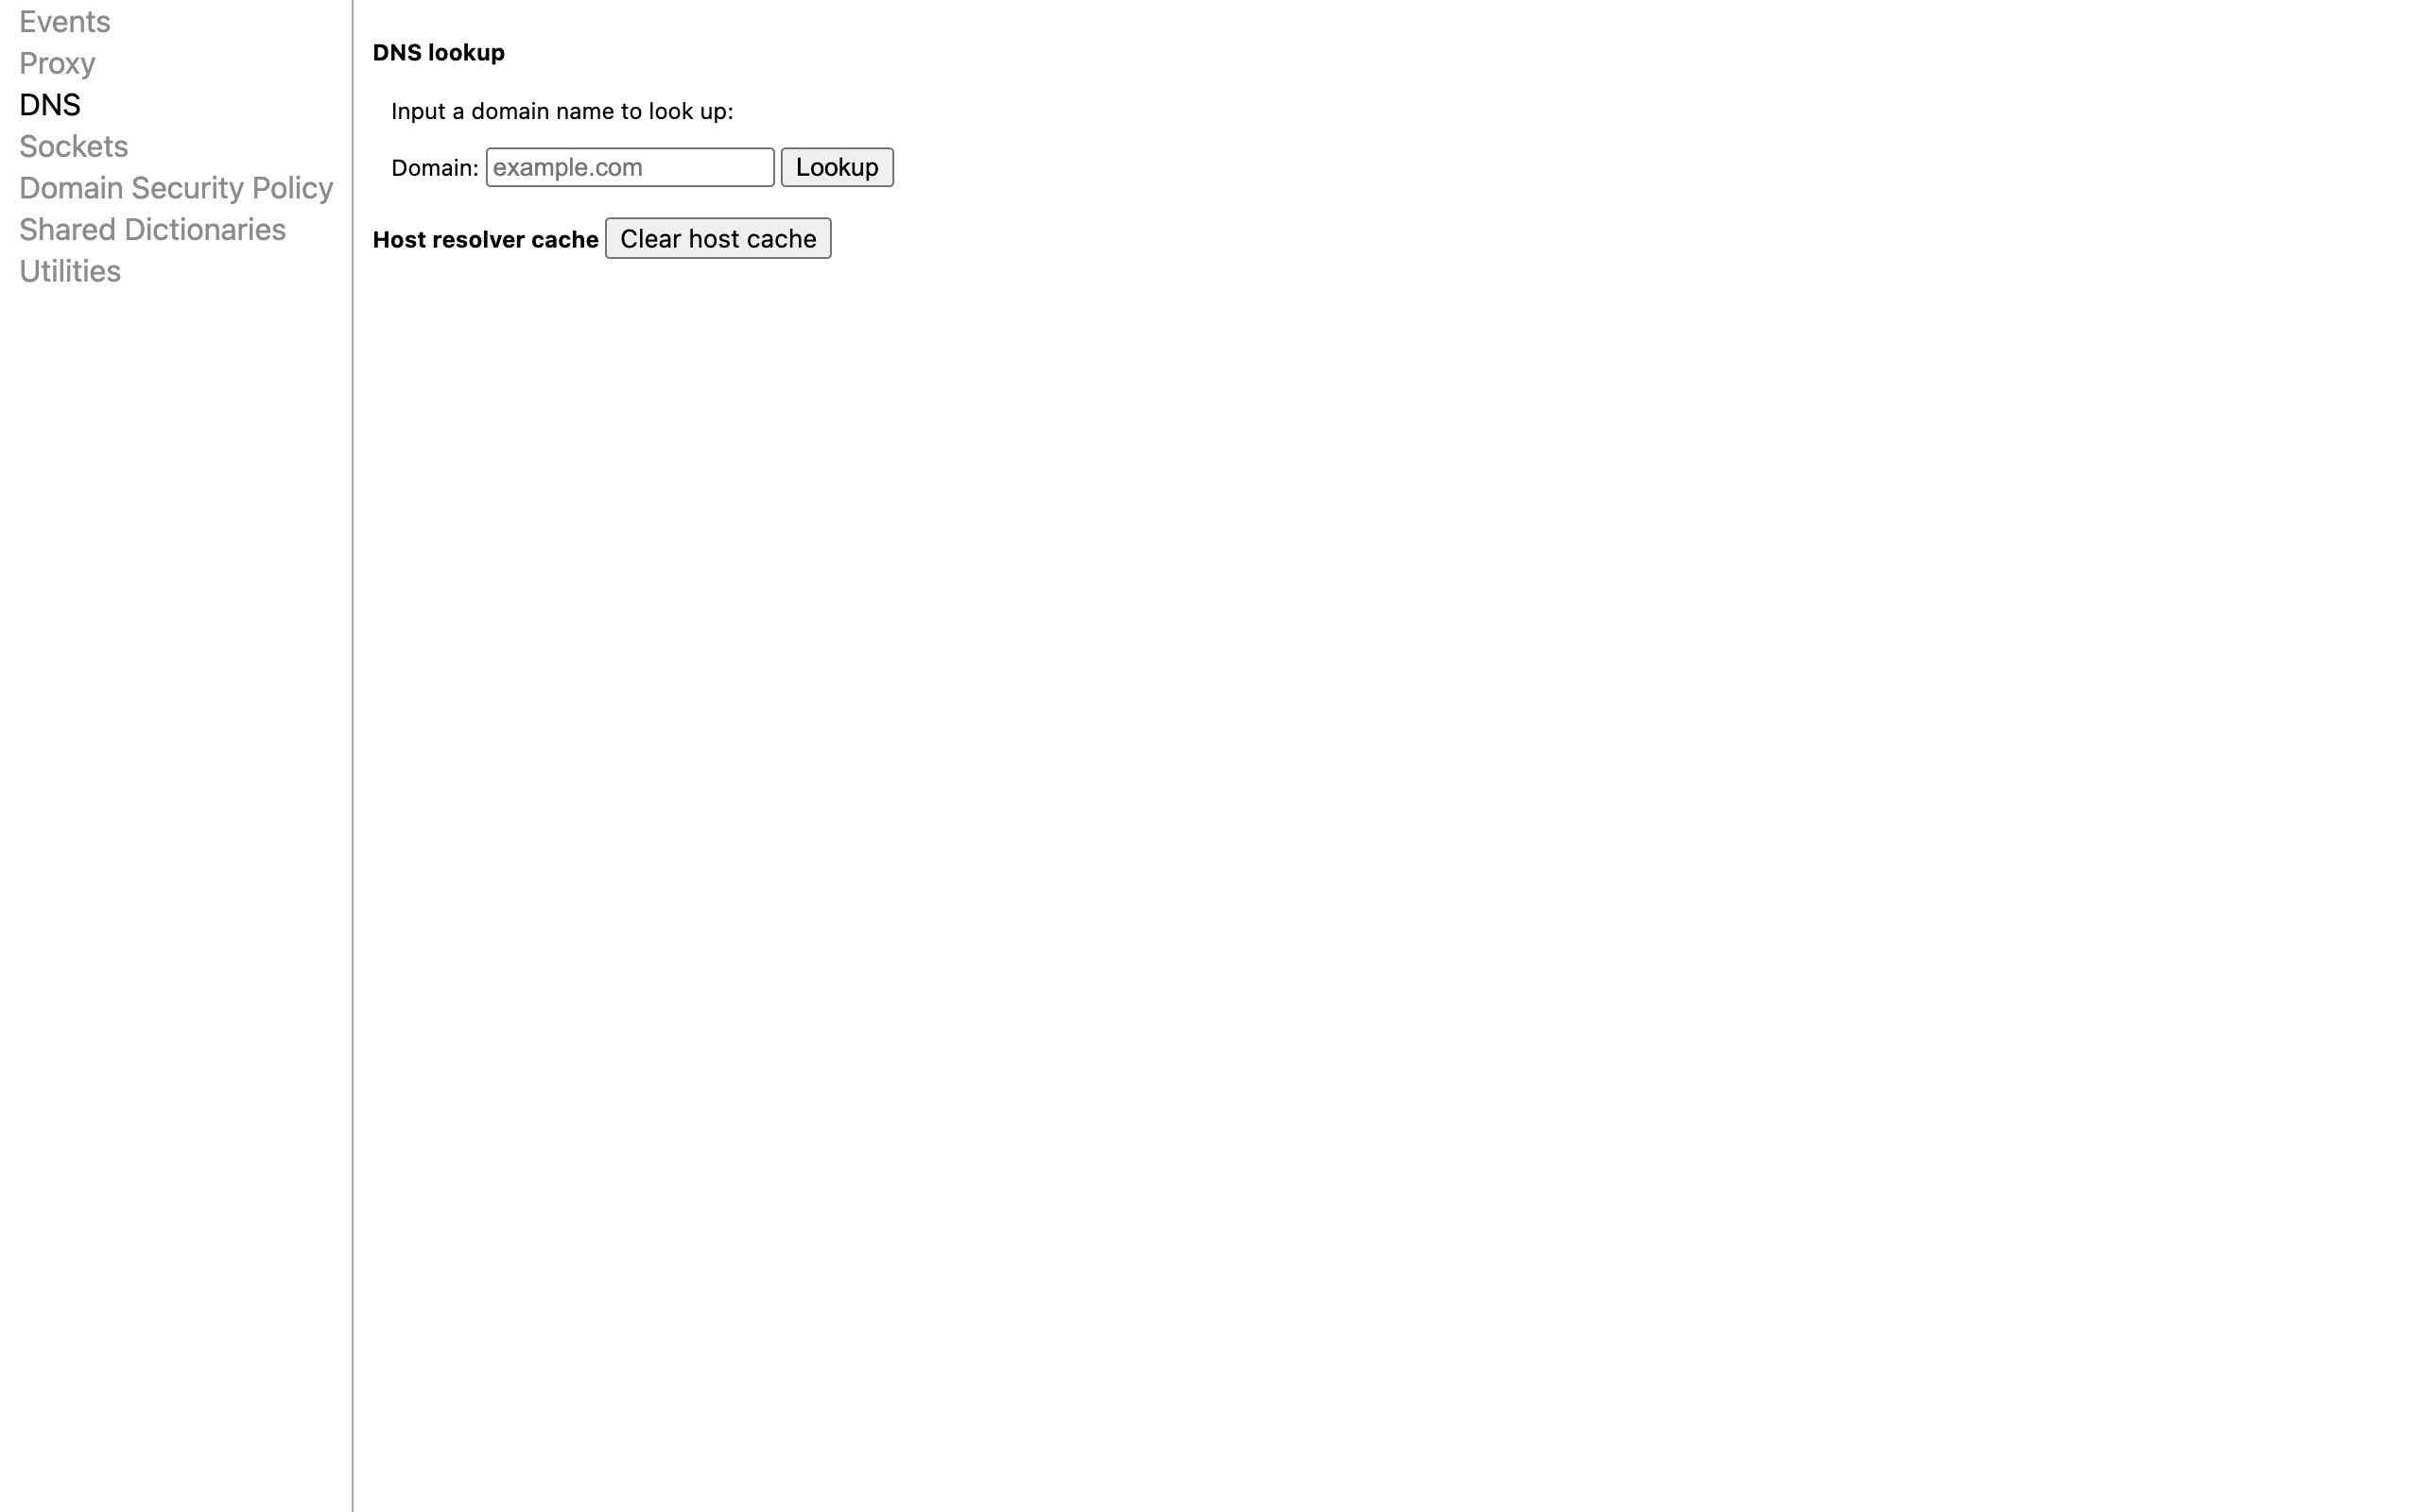
chrome://net-internals/#dns | DNS lookup tool and Clear host cache button | Anyone whose site "won't load" after a DNS change |
chrome://net-internals/#sockets | Socket pool view for stuck-connection troubleshooting | Developers, IT |
chrome://net-export | Record a network log to a file for support or analysis | Developers, IT |
chrome://inspect | Debug pages on Android devices over USB, service workers, remote targets | Web developers |
chrome://serviceworker-internals | Every registered service worker, with controls to inspect and unregister | Web developers |
chrome://policy | Every enterprise policy applied to this browser, exportable to JSON | IT admins, anyone seeing "managed by your organisation" |
chrome://management | Whether the browser is managed, and by whom | Everyone on a work laptop |
chrome://components | Separately-updated components (22 in my profile) with "Check for update" buttons | Troubleshooting DRM video, CRLSet, etc. |
chrome://crashes | Recent crash reports and their upload IDs | Bug reporters |
chrome://media-engagement | Per-site scores that decide whether a site may autoplay with sound | Anyone puzzled by autoplay behaviour |
chrome://site-engagement | How much Chrome thinks you use each site | Curious users |
chrome://webrtc-internals | Live stats and dumps for video calls | Developers, people debugging calls |
chrome://system | Full system diagnostic dump (versions, related website sets, more) | Support tickets |
chrome://tracing | Legacy trace viewer, now nudging you to the Perfetto UI (debug switch required) | Performance engineers |
chrome://dino | The offline dinosaur game, on demand | Everyone, honestly |
chrome://version Is the One to Memorise
If you learn one internal page, make it chrome://version. It answers "which Chrome am I actually running?" precisely (154.0.8037.93, official build, arm64 on my machine), and its Command Line row shows the --flag-switches-begin … --flag-switches-end block — every flag you have enabled from chrome://flags, in one line. That makes it the fastest audit of experiments you forgot about; are Chrome flags safe walks through that audit in detail.
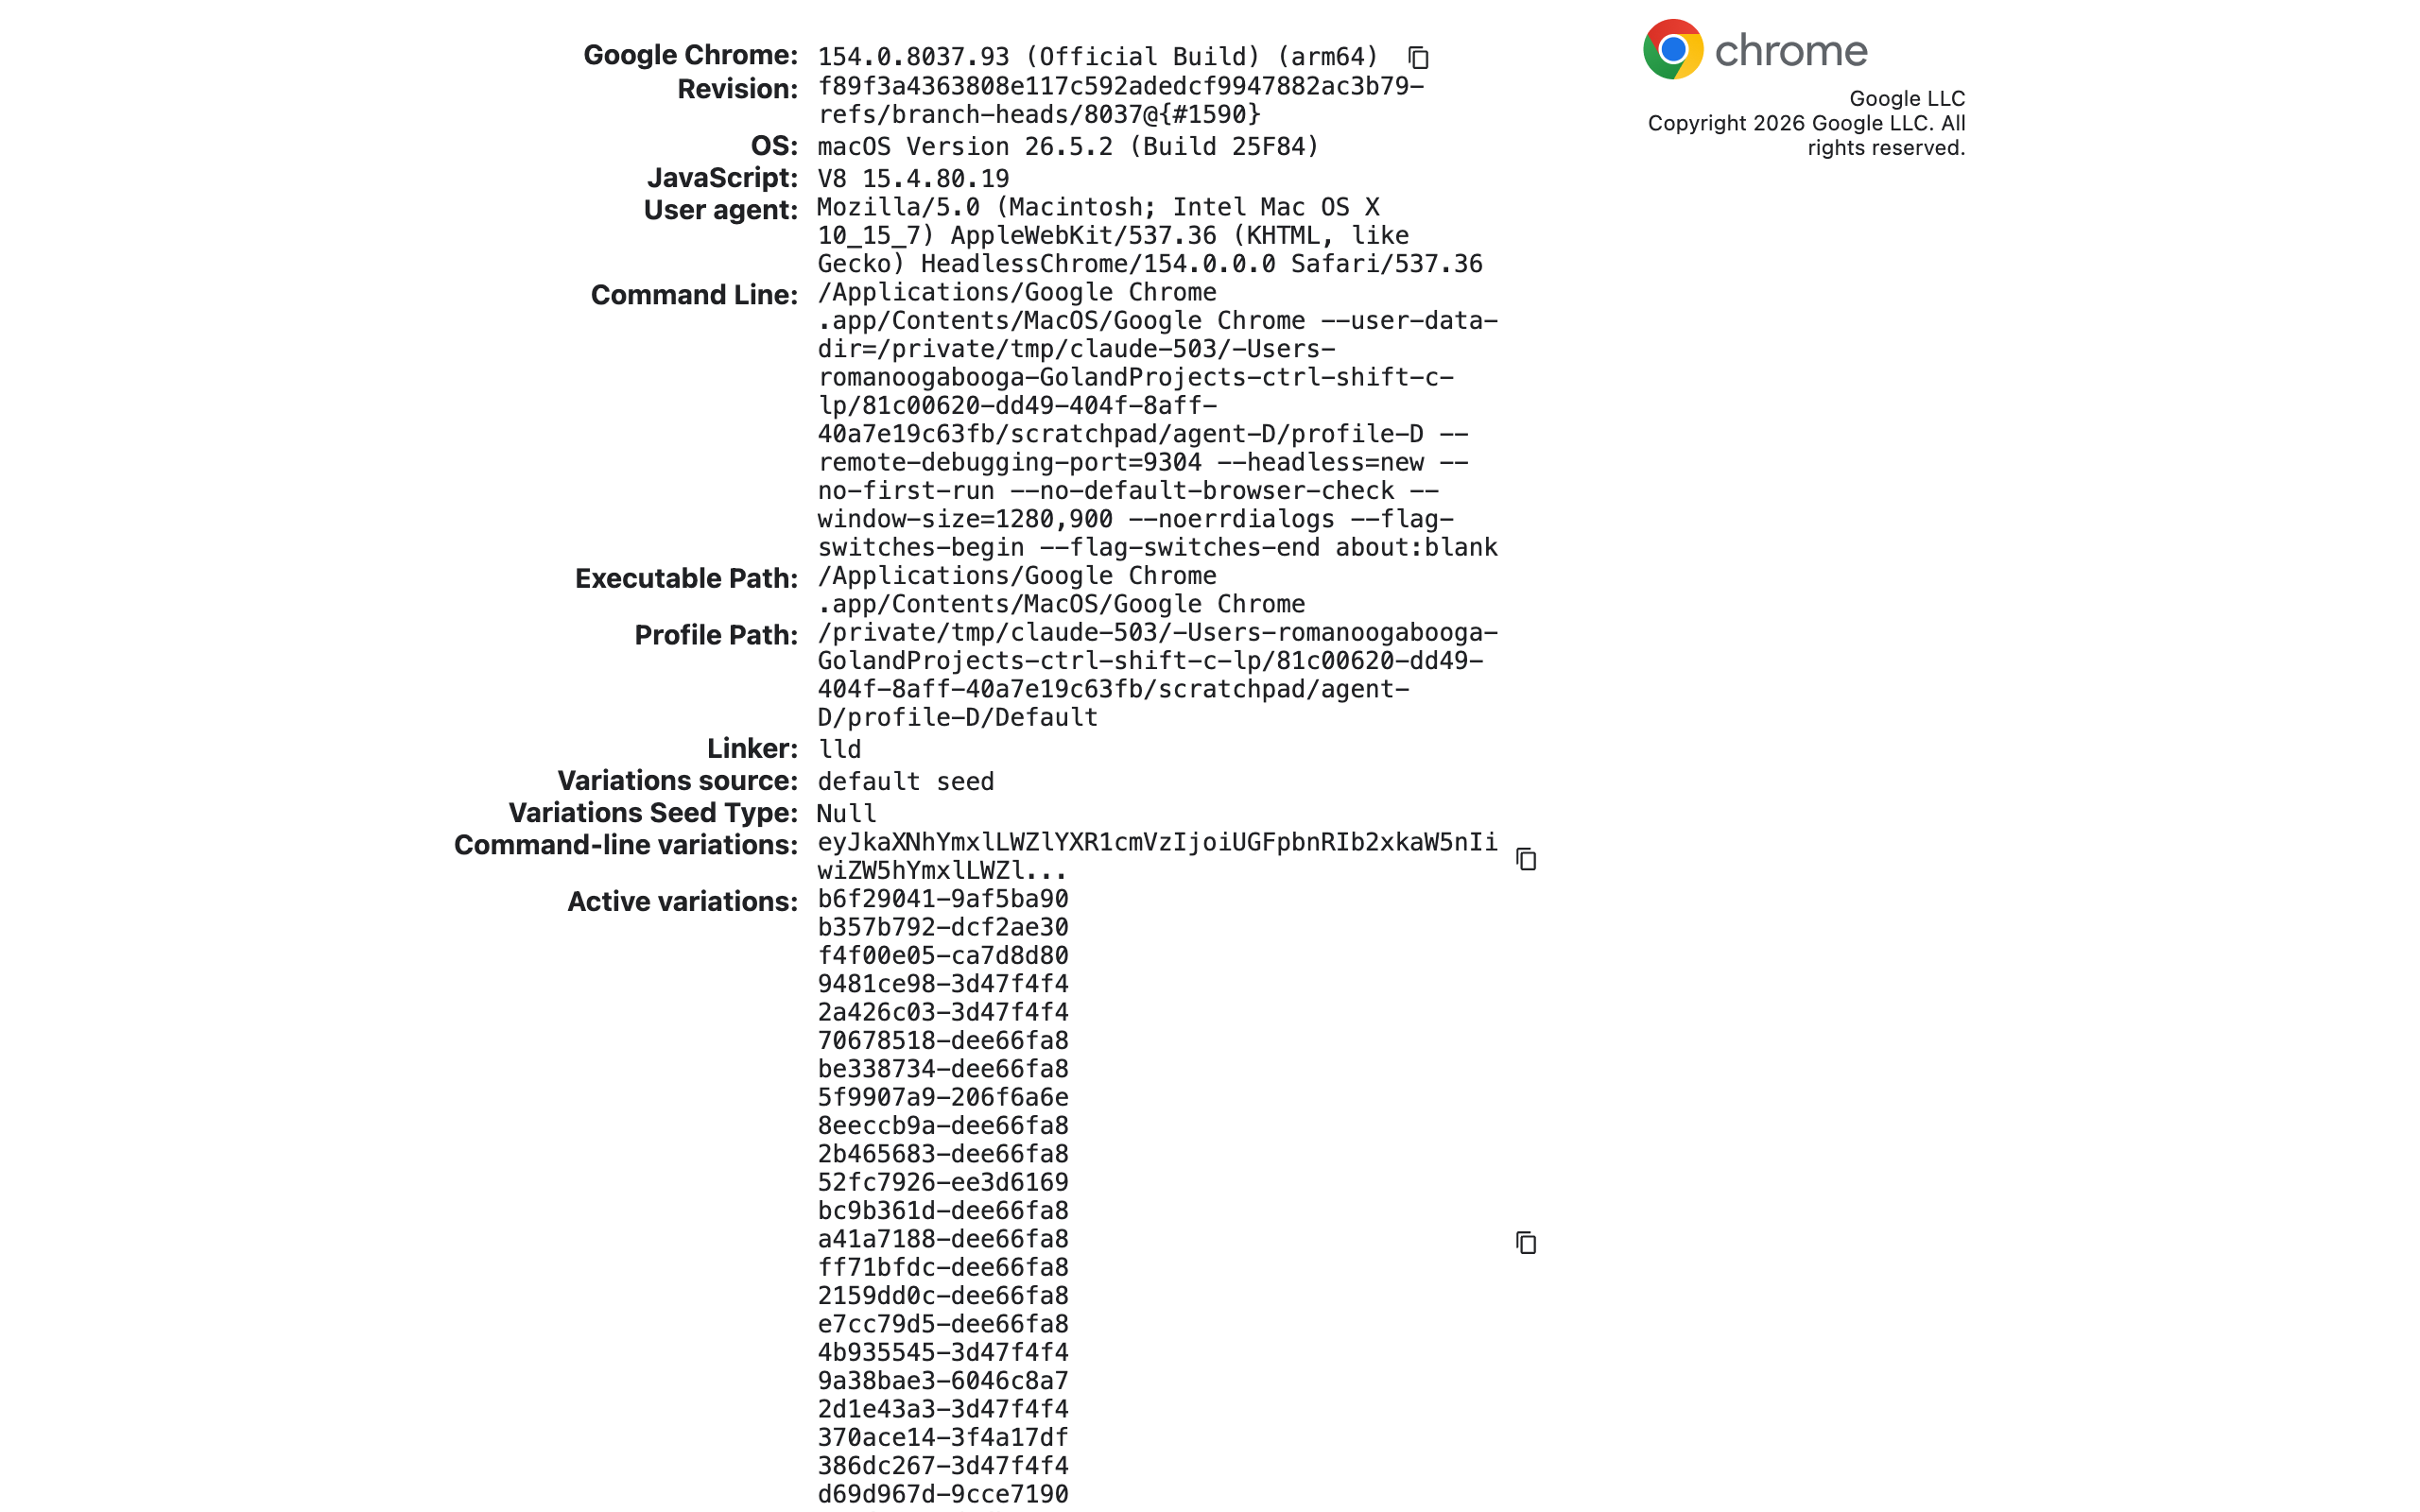
It also shows the Profile Path — the folder where your bookmarks, history and extensions live — which is the answer to half of all "where does Chrome store…" questions.
Pages That No Longer Work
Old tutorials keep recommending URLs that are gone. Verified on Chrome 154:
| URL from older guides | What happens now | Use instead |
|---|---|---|
chrome://settings/adPrivacy | Falls back to the main chrome://settings page | Settings → Privacy and security |
chrome://settings/privacySandbox | Falls back to the main chrome://settings page | Settings → Privacy and security |
chrome://memory | ERR_INVALID_URL | Chrome task manager |
chrome://memory-redirect | ERR_INVALID_URL | Chrome task manager |
chrome://sandbox | ERR_INVALID_URL | chrome://process-internals |
chrome://net-internals/#events | Page says the events viewer "has been removed" | chrome://net-export + the external netlog viewer |
chrome://discards, chrome://tracing (direct) | Redirect to chrome://debug-webuis-disabled | Enable internal debugging pages first |
The settings fallbacks are sneaky: there is no error, just the main settings page, so it looks like the link worked. For memory, the replacement is genuinely better — the Chrome task manager guide shows how to find the tab or iframe that is actually causing lag, with measured per-process numbers.
The Command URLs You Should Never Open
The bottom section of chrome://chrome-urls lists 31 URLs that Chrome deliberately does not link, with the warning that "they crash or hang the renderer". They exist so Chrome engineers can test crash reporting and recovery. Typing them by hand does exactly what they say:
chrome://kill— kills the current tab's renderer. On a throwaway test profile the navigation was aborted (ERR_ABORTED) — the renderer was killed. Harmless but pointless.chrome://hang,chrome://shorthang,chrome://uithreadhang— freeze the tab or the browser UI.chrome://crashand the twelvechrome://crash/browser|gpu|renderer/...variants — deliberately trigger memory errors (use-after-free, heap overflow) in that process.chrome://gpucrash,chrome://gpuhang,chrome://gpuclean— target the GPU process.chrome://memory-exhaust,chrome://memory-pressure-critical,chrome://memory-pressure-moderate— simulate running out of memory.chrome://inducebrowsercrashforrealz,chrome://inducebrowserdcheckforrealz,chrome://badcastcrash,chrome://crashdump— crash the whole browser.chrome://quitandchrome://restart— close or relaunch Chrome, every window and tab.
The only one with an everyday use is chrome://restart, which relaunches Chrome — handy after changing flags. Everything else belongs in a test lab, and I ran this whole survey in a throwaway profile for exactly that reason.
Where Internal Pages Fit With Flags and Settings
Think of Chrome's configurable surface in three layers. Settings are supported and safe. Internal pages are diagnostics and power tools — mostly read-only, occasionally with a button that changes state. Flags are unfinished experiments that can change at every release. Most "secret Chrome tricks" articles mix all three; knowing which layer you are in tells you how careful to be.
If you are here for performance, start with the task manager and chrome://settings/performance, then how to speed up Chrome. If you are here for experiments, the vetted shortlist is Chrome flags useful settings. And if you want the internal pages that open with a keystroke rather than a URL, hidden Chrome keyboard shortcuts covers those.
Frequently Asked Questions
How do I see all Chrome internal pages? Type chrome://chrome-urls (or chrome://about, which redirects there) into the address bar. In Chrome 154 it lists 199 entries: 128 regular pages, 40 internal debugging pages and 31 debug command URLs.
How many chrome:// pages are there? In Chrome 154 on macOS, chrome://chrome-urls lists 167 unique pages (118 chrome:// and 10 chrome-untrusted:// in the main list plus 40 debugging pages, one listed twice) and 31 command URLs. Of the 157 chrome:// pages, 133 opened in a normal tab in my testing.
Why does chrome://discards say internal debugging pages are disabled? Since Chrome moved some diagnostic pages behind a switch, pages in that section, such as chrome://discards, redirect to chrome://debug-webuis-disabled until you enable them. Open chrome://chrome-urls and click Enable internal debugging pages to turn them on.
Which chrome:// URLs should I never open? The command URLs at the bottom of chrome://chrome-urls, such as chrome://kill, chrome://hang, chrome://crash, chrome://gpucrash, chrome://memory-exhaust, chrome://inducebrowsercrashforrealz, chrome://quit and chrome://restart. They deliberately crash, hang or close parts of Chrome.
Does chrome://settings/adPrivacy still work? No. In Chrome 154 both chrome://settings/adPrivacy and chrome://settings/privacySandbox no longer resolve to their own page; Chrome silently falls back to the main chrome://settings page.
Are chrome:// internal pages safe to use? Reading them is safe; they are local diagnostic and settings pages. Be careful with buttons that change state, such as Reset all on chrome://flags or Clear host cache on chrome://net-internals, and never open the debug command URLs.
What happened to chrome://memory and chrome://net-internals events? chrome://memory and chrome://memory-redirect return ERR_INVALID_URL in Chrome 154; use the Chrome task manager instead. The net-internals events viewer has been removed, and the page itself points you to chrome://net-export for network logs.
One Shortcut Chrome Never Shipped
After 199 internal URLs, there is still no built-in way to copy the current tab's address with a single keystroke. Ctrl+Shift+C adds exactly that: one shortcut, URL on the clipboard, no data collected — and you can remap it at chrome://extensions/shortcuts, one of the internal pages that is actually worth knowing.
Try Ctrl+Shift+C
Copy any URL with one keyboard shortcut. Free forever, no data collected.