Chrome Task Manager: Fix Lag Without Restarting (2026)
The Chrome task manager is the fastest way to fix lag without restarting the browser: open it with Shift+Esc (or More tools → Task manager on a Mac), sort by CPU, and end the one process that is busy while you are not using it. Nine times out of ten the culprit is a single tab, iframe or extension, and the rest of your session survives untouched.
That is the short version. The longer version matters because the task manager is easy to misread. Memory is the column everyone looks at, and it is usually the wrong one. One tab can be spread across four processes. And the worst offender I measured used less memory than a blank page.
To get real numbers instead of folklore, I loaded a light page, two heavy news homepages and a deliberately broken page into Chrome 154.0.8037.93 on macOS (Apple Silicon), each in a fresh browser instance, and measured every Chrome process with the DevTools Protocol (SystemInfo.getProcessInfo for CPU time, Performance.getMetrics for JavaScript heap and DOM size) plus macOS's footprint tool for per-process memory. Each test ran twice; the numbers below are the range across both runs.
How to Open the Chrome Task Manager
| Platform | Shortcut | Menu path |
|---|---|---|
| Windows | Shift+Esc | ⋮ → More tools → Task manager |
| Linux | Shift+Esc | ⋮ → More tools → Task manager |
| ChromeOS | Search+Esc | ⋮ → More tools → Task manager |
| macOS | (use the menu) | ⋮ → More tools → Task manager, or Window → Task Manager |
It opens as its own small window, separate from the operating system's Activity Monitor or Windows Task Manager. On Windows, do not confuse the two: Ctrl+Shift+Esc opens the Windows one, Shift+Esc opens Chrome's.
What Every Row Means (Process Types)
Chrome is not one program. It is a coordinator plus a fleet of sandboxed workers, and the task manager shows each worker as a row. Here is what a completely fresh Chrome 154 profile was running with nothing but a blank tab open — seven processes, about 345–353 MB of total footprint across all of them:
| Row in the task manager | What it is | Idle footprint (my test) | Should you end it? |
|---|---|---|---|
| Browser | The main process: windows, tabs, settings, history | ~101–113 MB | No — closes Chrome |
| GPU Process | Compositing, video decode, WebGL | ~81–100 MB, more with video | Only if graphics glitch; Chrome restarts it |
| Utility: Network Service | All network requests | ~23–29 MB | No |
| Utility: Storage Service | Cookies, local storage, IndexedDB | ~19 MB | No |
| Tab: page title | The renderer for one site in one tab | 25–35 MB for a light page | Yes, if misbehaving |
| Subframe: https://site | A cross-site iframe (ad, embed, captcha) in its own process | 25–90 MB each | Yes — the parent tab keeps working |
| Extension: name | An extension's background or service worker | Varies | Yes, if misbehaving |
| Spare Renderer | A pre-started empty renderer so the next tab opens faster | ~25 MB | Pointless — Chrome makes another |
Two rows surprise people. Spare Renderer is Chrome warming up a process before you need it; it is why, in my runs, the renderer that ended up hosting a new page had usually been started before the page was opened. Subframe rows are site isolation at work: every cross-site iframe on a page gets its own process, so a page full of ads is really a page plus a handful of hidden mini-pages. Chrome's own chrome://process-internals page shows the same thing as a tree:
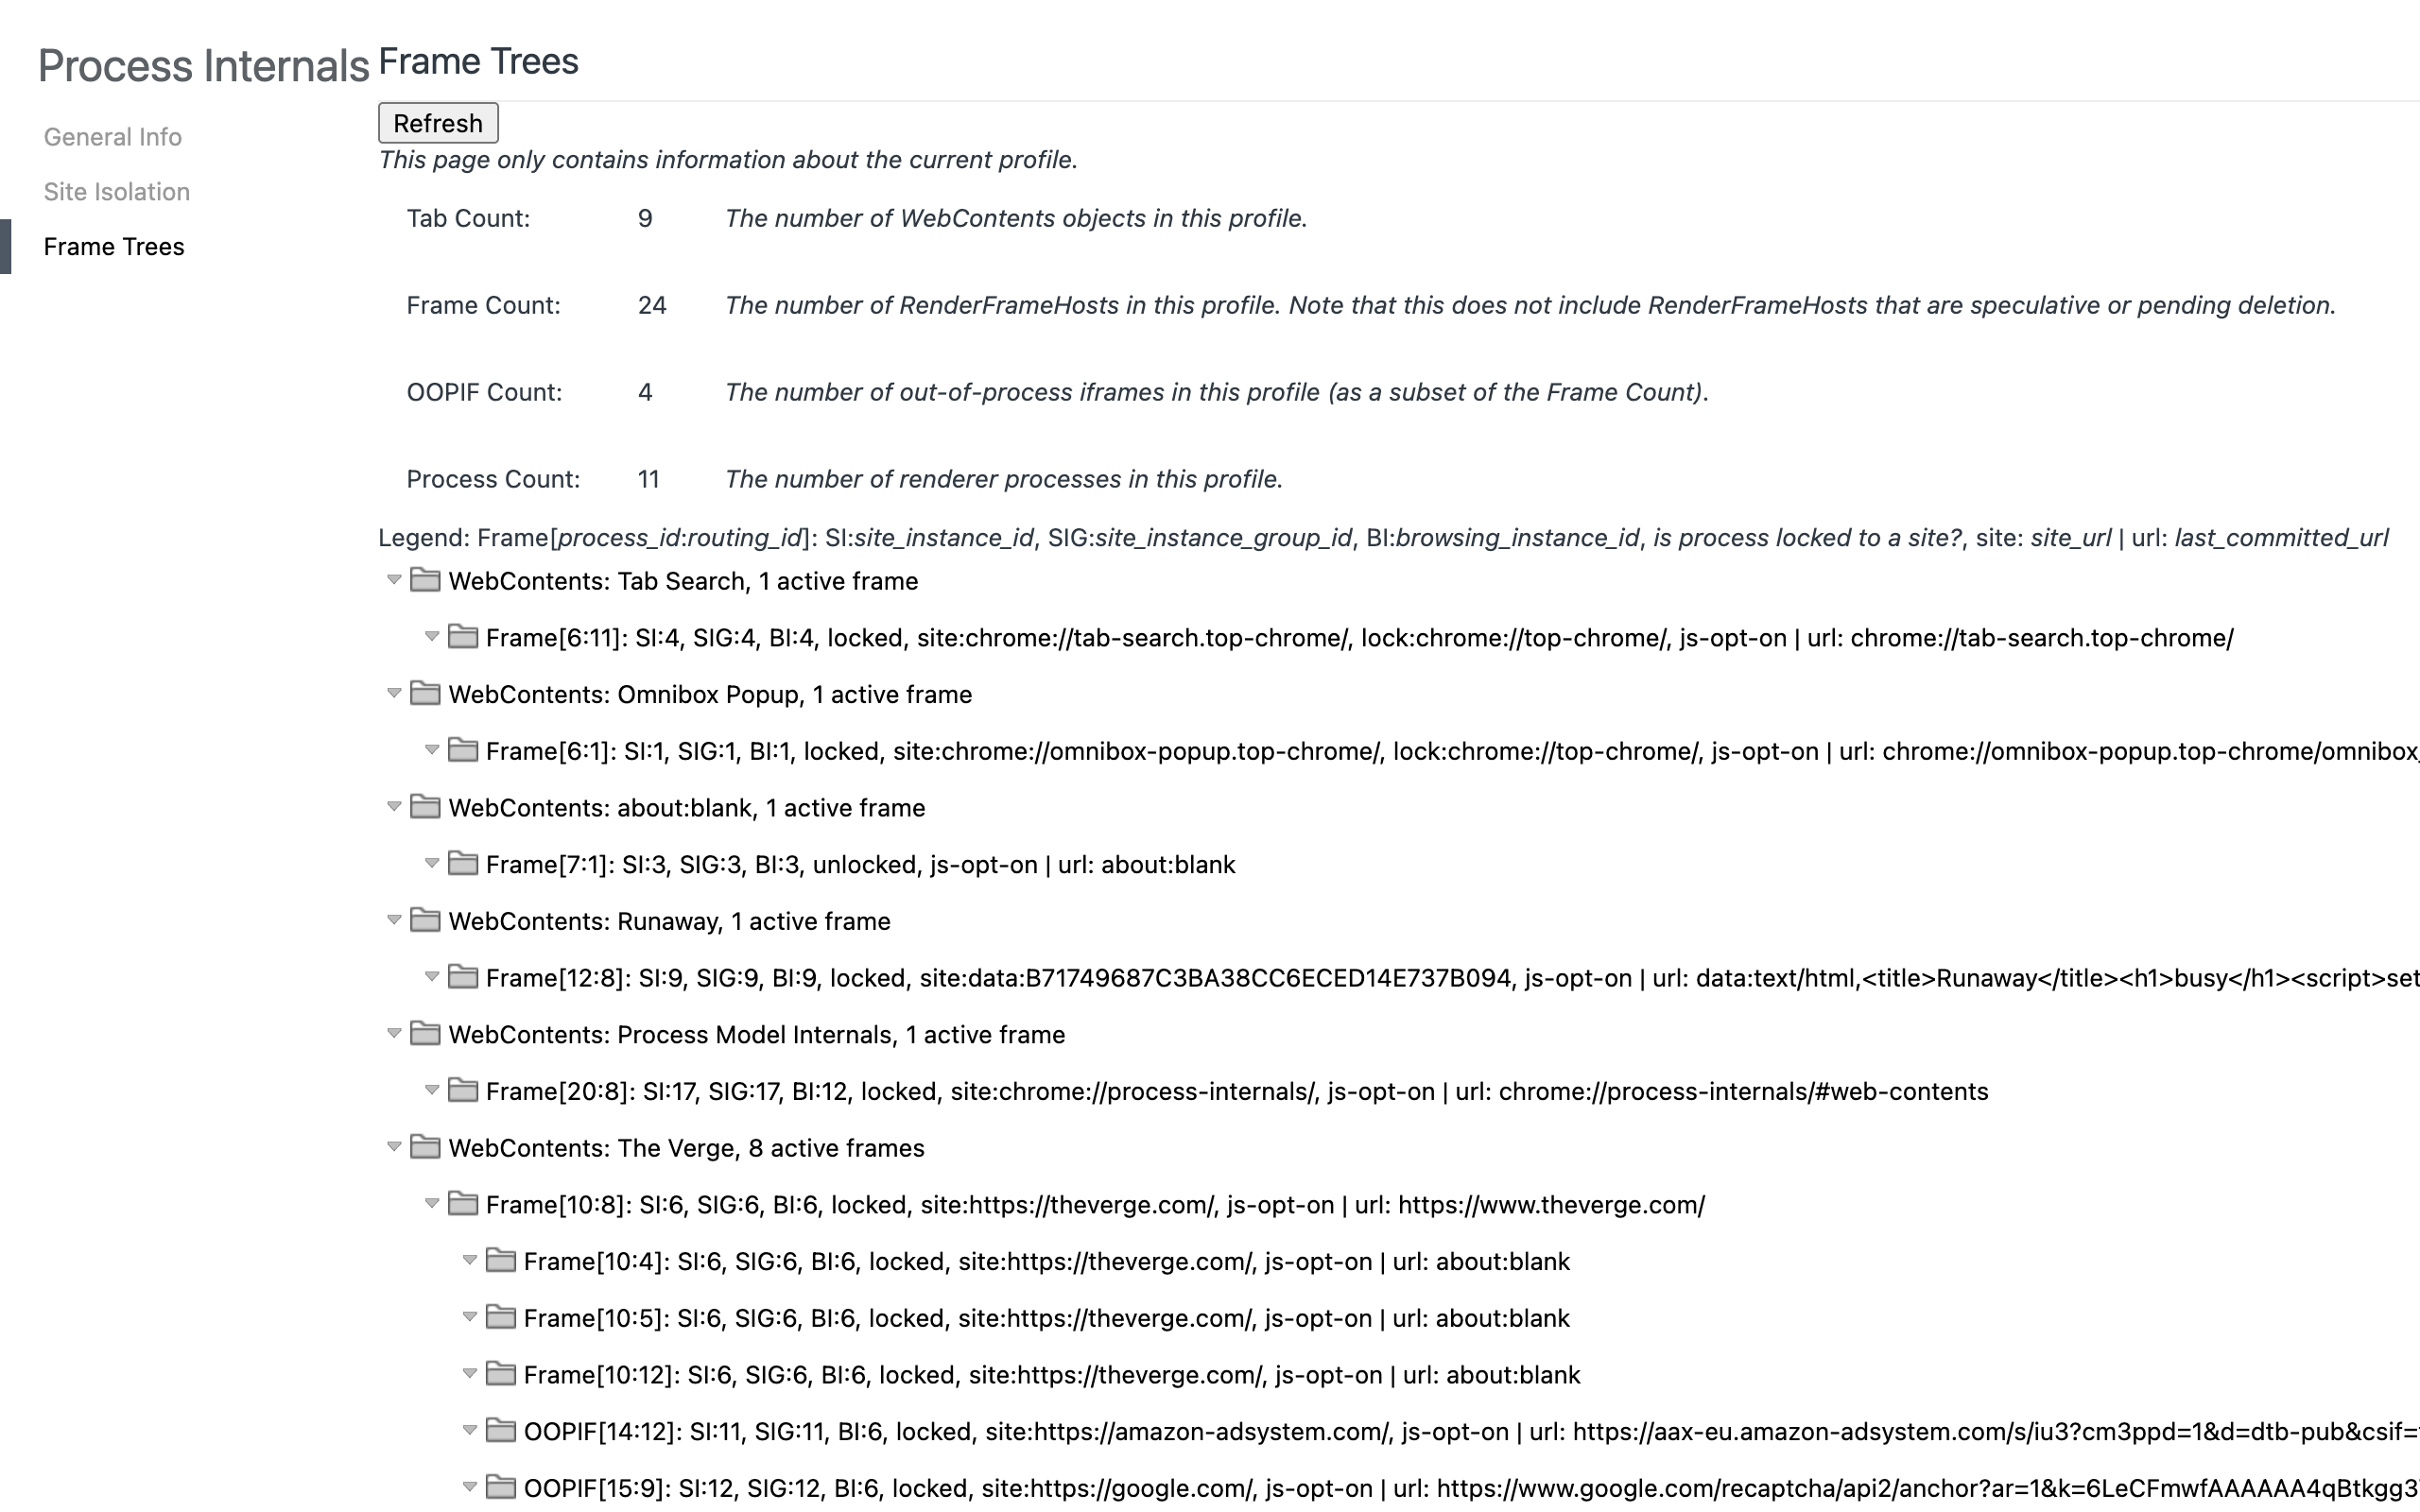
In that capture, The Verge's tab had 8 frames, and two of them — an Amazon ad-system iframe and a Google reCAPTCHA — were out-of-process iframes (OOPIFs). Each of those is a "Subframe" row in the task manager, and each costs memory that the tab's own row does not show.
Real Numbers: A Light Page vs Two Heavy Ones
Each page was loaded into a fresh instance of Chrome 154, left for 20 seconds to settle, then measured over a 10-second idle window with no scrolling or input. "Added footprint" is the total memory of all Chrome processes after loading, minus the baseline of the fresh browser.
| Page | Added footprint (all processes) | Process count (fresh browser: 7) | Main renderer footprint | Idle CPU of main renderer | JS heap | DOM nodes | Frames |
|---|---|---|---|---|---|---|---|
| example.com | +34–36 MB | 8 | 33–35 MB | 0% | 0.8 MB | 64 | 4 |
| theverge.com | +401–410 MB | 10 | 261–267 MB | 0.5–1% | 55–60 MB | 7,698–8,176 | 13–15 |
| cnn.com | +518–549 MB | 13 | 255–287 MB | 12.9–15.1% | 40–44 MB | 10,950–11,153 | 22 |
| Runaway test page | +30 MB | 8 | ~31 MB | 88.7–88.8% | 0.6–1.3 MB | 22 | 4 |
What those numbers tell you:
- A heavy news homepage costs roughly 11–16× a light page in memory, and only half to two-thirds of that shows up on the tab's biggest row. The rest is spread over subframe renderers, a bigger GPU process and helper services.
- CNN kept working while "idle". Its renderer sat at 13–15% CPU and the GPU process at 9–11% with nobody touching it — almost certainly the autoplaying video. It also spawned a
media.mojom.CdmServiceBrokerutility process (~91 MB), the service Chrome uses for protected media. Ten of those tabs is your fan noise. - The Verge was heavy but quiet. Over 400 MB, yet under 1% CPU when idle. That tab costs RAM, not responsiveness — and Memory Saver handles that case automatically.
- The runaway page is the real lag. My test page runs a 45 ms busy loop every 50 ms, which is what a buggy script, a crypto-miner or a broken ad looks like from the inside. It pinned one core at ~89% CPU while using less memory than example.com. Sort the task manager by memory and you would never find it.
That last row is the whole argument of this post. Lag comes from CPU, not from memory, until you actually run out of RAM.
Fix Lag in Four Steps
This is the routine I use, and it takes under a minute.
1. Open the task manager and sort by CPU. Click the CPU column header. Wait five seconds — the values are live, and a single spike means nothing. You are looking for a row that stays high.
2. Judge the top rows against what you are doing. A video call, a playing video or a page you are actively scrolling is allowed to use CPU. A background tab you have not looked at in an hour is not. In my measurements, quiet pages idled at 0–1%; anything holding double digits in the background deserves suspicion, and anything near 90–100% is your lag.
3. Select it and click End process. For a Tab row, the tab turns into a "page crashed" screen ("Aw, Snap!" style) and reloads when you click it. For a Subframe row, the parent page stays up and just that iframe dies — great for killing a misbehaving ad without losing a half-written comment on the page. For an Extension row, Chrome stops it until it is next needed.
4. Only then look at memory. Sort by Memory footprint, and if your system is genuinely short on RAM (the OS is swapping, apps beyond Chrome are slow), close or discard the biggest tabs. If it is not, high memory is not hurting you.
If the same site keeps returning to the top of the CPU list, the durable fix is blocking it or its ads, not killing it daily. The broader cleanup — extensions, startup settings, hardware acceleration — is in how to speed up Chrome.
Which Columns to Enable
Right-click any column header in the task manager to add or remove columns. The defaults (Task, Memory footprint, CPU, Network, Process ID) are fine for a quick look. These additions make diagnosis much faster:
| Column | Why enable it | What "bad" looks like |
|---|---|---|
| CPU time | Total CPU a process has used since it started — catches tabs that spike when you are not watching | A background tab with far more CPU time than the tab you actually use |
| JavaScript memory | Separates script heap from images/DOM; growth over time suggests a leak | A long-open web app climbing steadily over hours |
| Idle wake ups | How often a process wakes the CPU — the battery killer on laptops | Hundreds per second from a tab you are not using |
| GPU memory | Shows tabs leaning on the graphics process (WebGL, video, heavy animation) | A static-looking page holding lots of GPU memory |
| Image cache | Image-heavy pages and infinite scroll | Huge values on a page you scrolled far down |
| Process ID | Lets you match a row to Activity Monitor / Windows Task Manager | — |
Column names and availability vary slightly by platform; the ones above are the ones I would add first.
Finding a Bad Extension
Extensions get their own rows, prefixed with "Extension:". A good utility extension should be nearly invisible: zero CPU when idle, a small footprint, and — for event-driven Manifest V3 extensions — often no row at all, because the service worker shuts down after a few seconds of inactivity. That last point catches people out: an extension that is missing from the list is usually a well-behaved one, not a broken one.
Red flags:
- Constant CPU from an extension row while you are not interacting with it. Something is polling, scraping or animating in the background.
- Memory that only grows across a day of use.
- Many processes from a single extension, or extension activity attached to every tab — a sign it injects scripts into every page you open.
To confirm, disable the suspect at chrome://extensions, reproduce what you were doing, and compare.
When the Task Manager Is Not Enough
The task manager answers "which process?". Three built-in tools answer the follow-up questions:
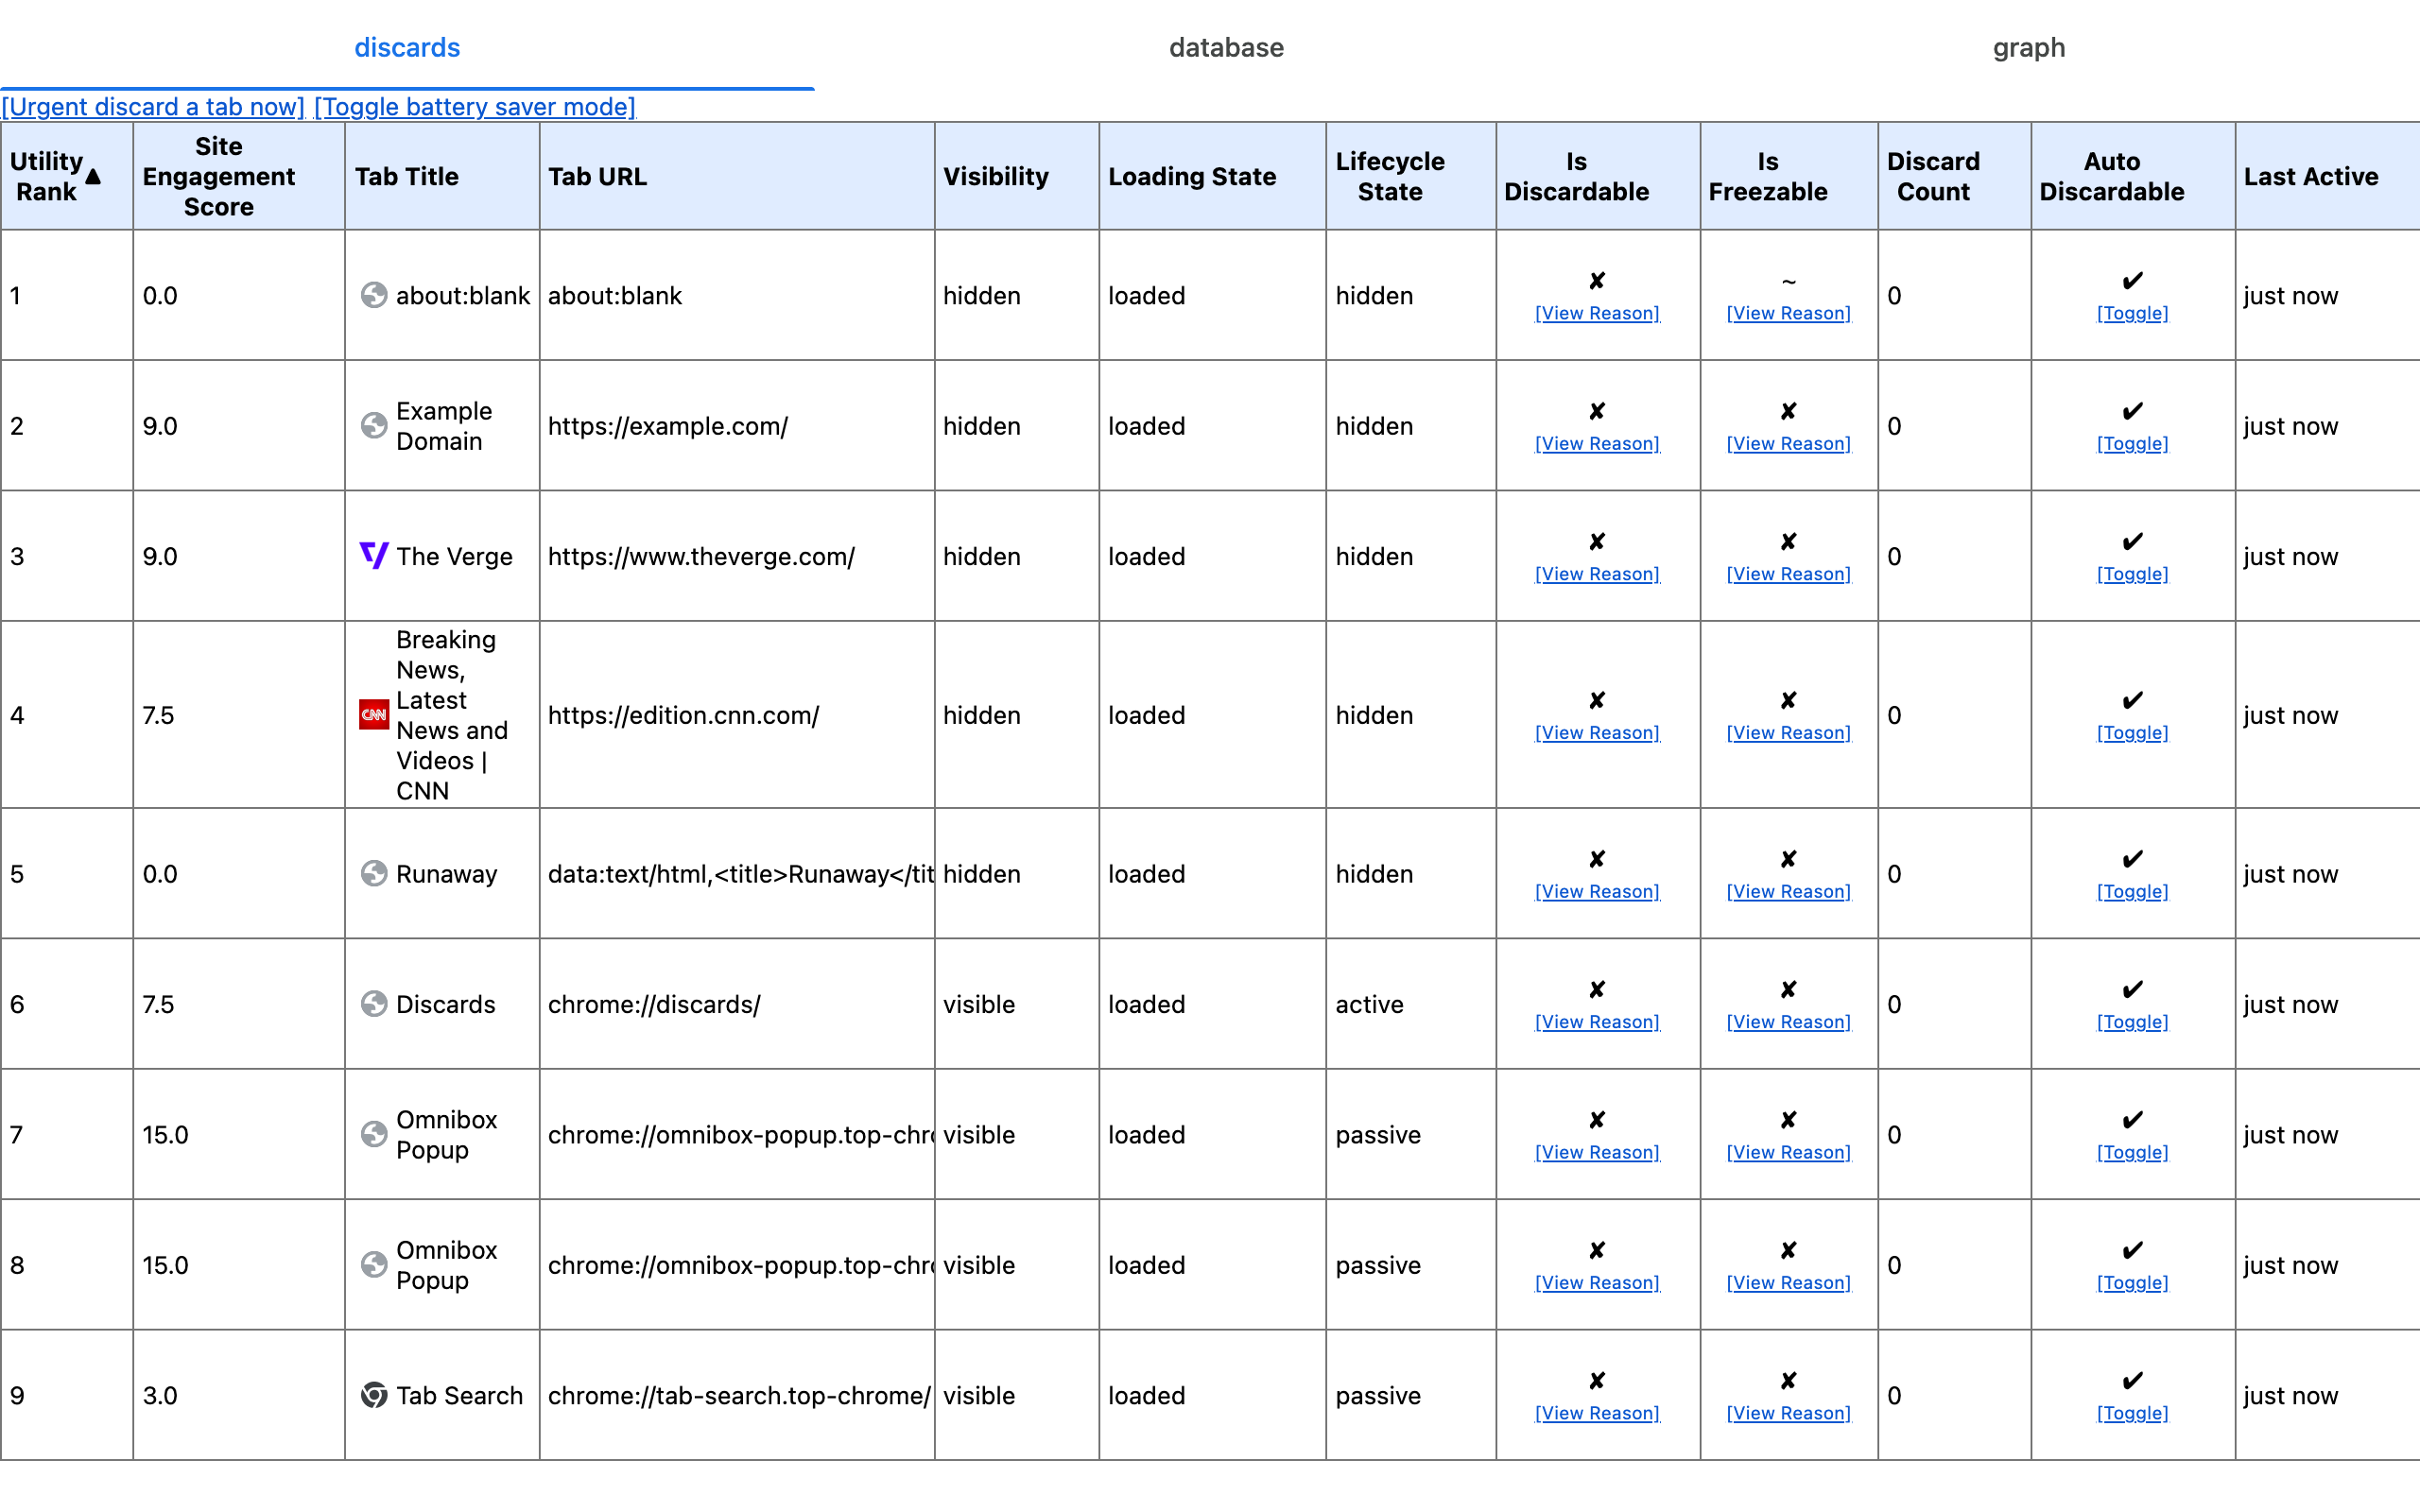
chrome://discards — Lists every tab with its lifecycle state, whether Chrome considers it discardable, and how many times it has been discarded. It has an "Urgent discard a tab now" link, which frees a tab's memory without closing it — the tab reloads when you return. In Chrome 154 this page sits behind the "internal debugging pages" switch on chrome://chrome-urls; the Chrome internal pages guide explains how to turn that on.
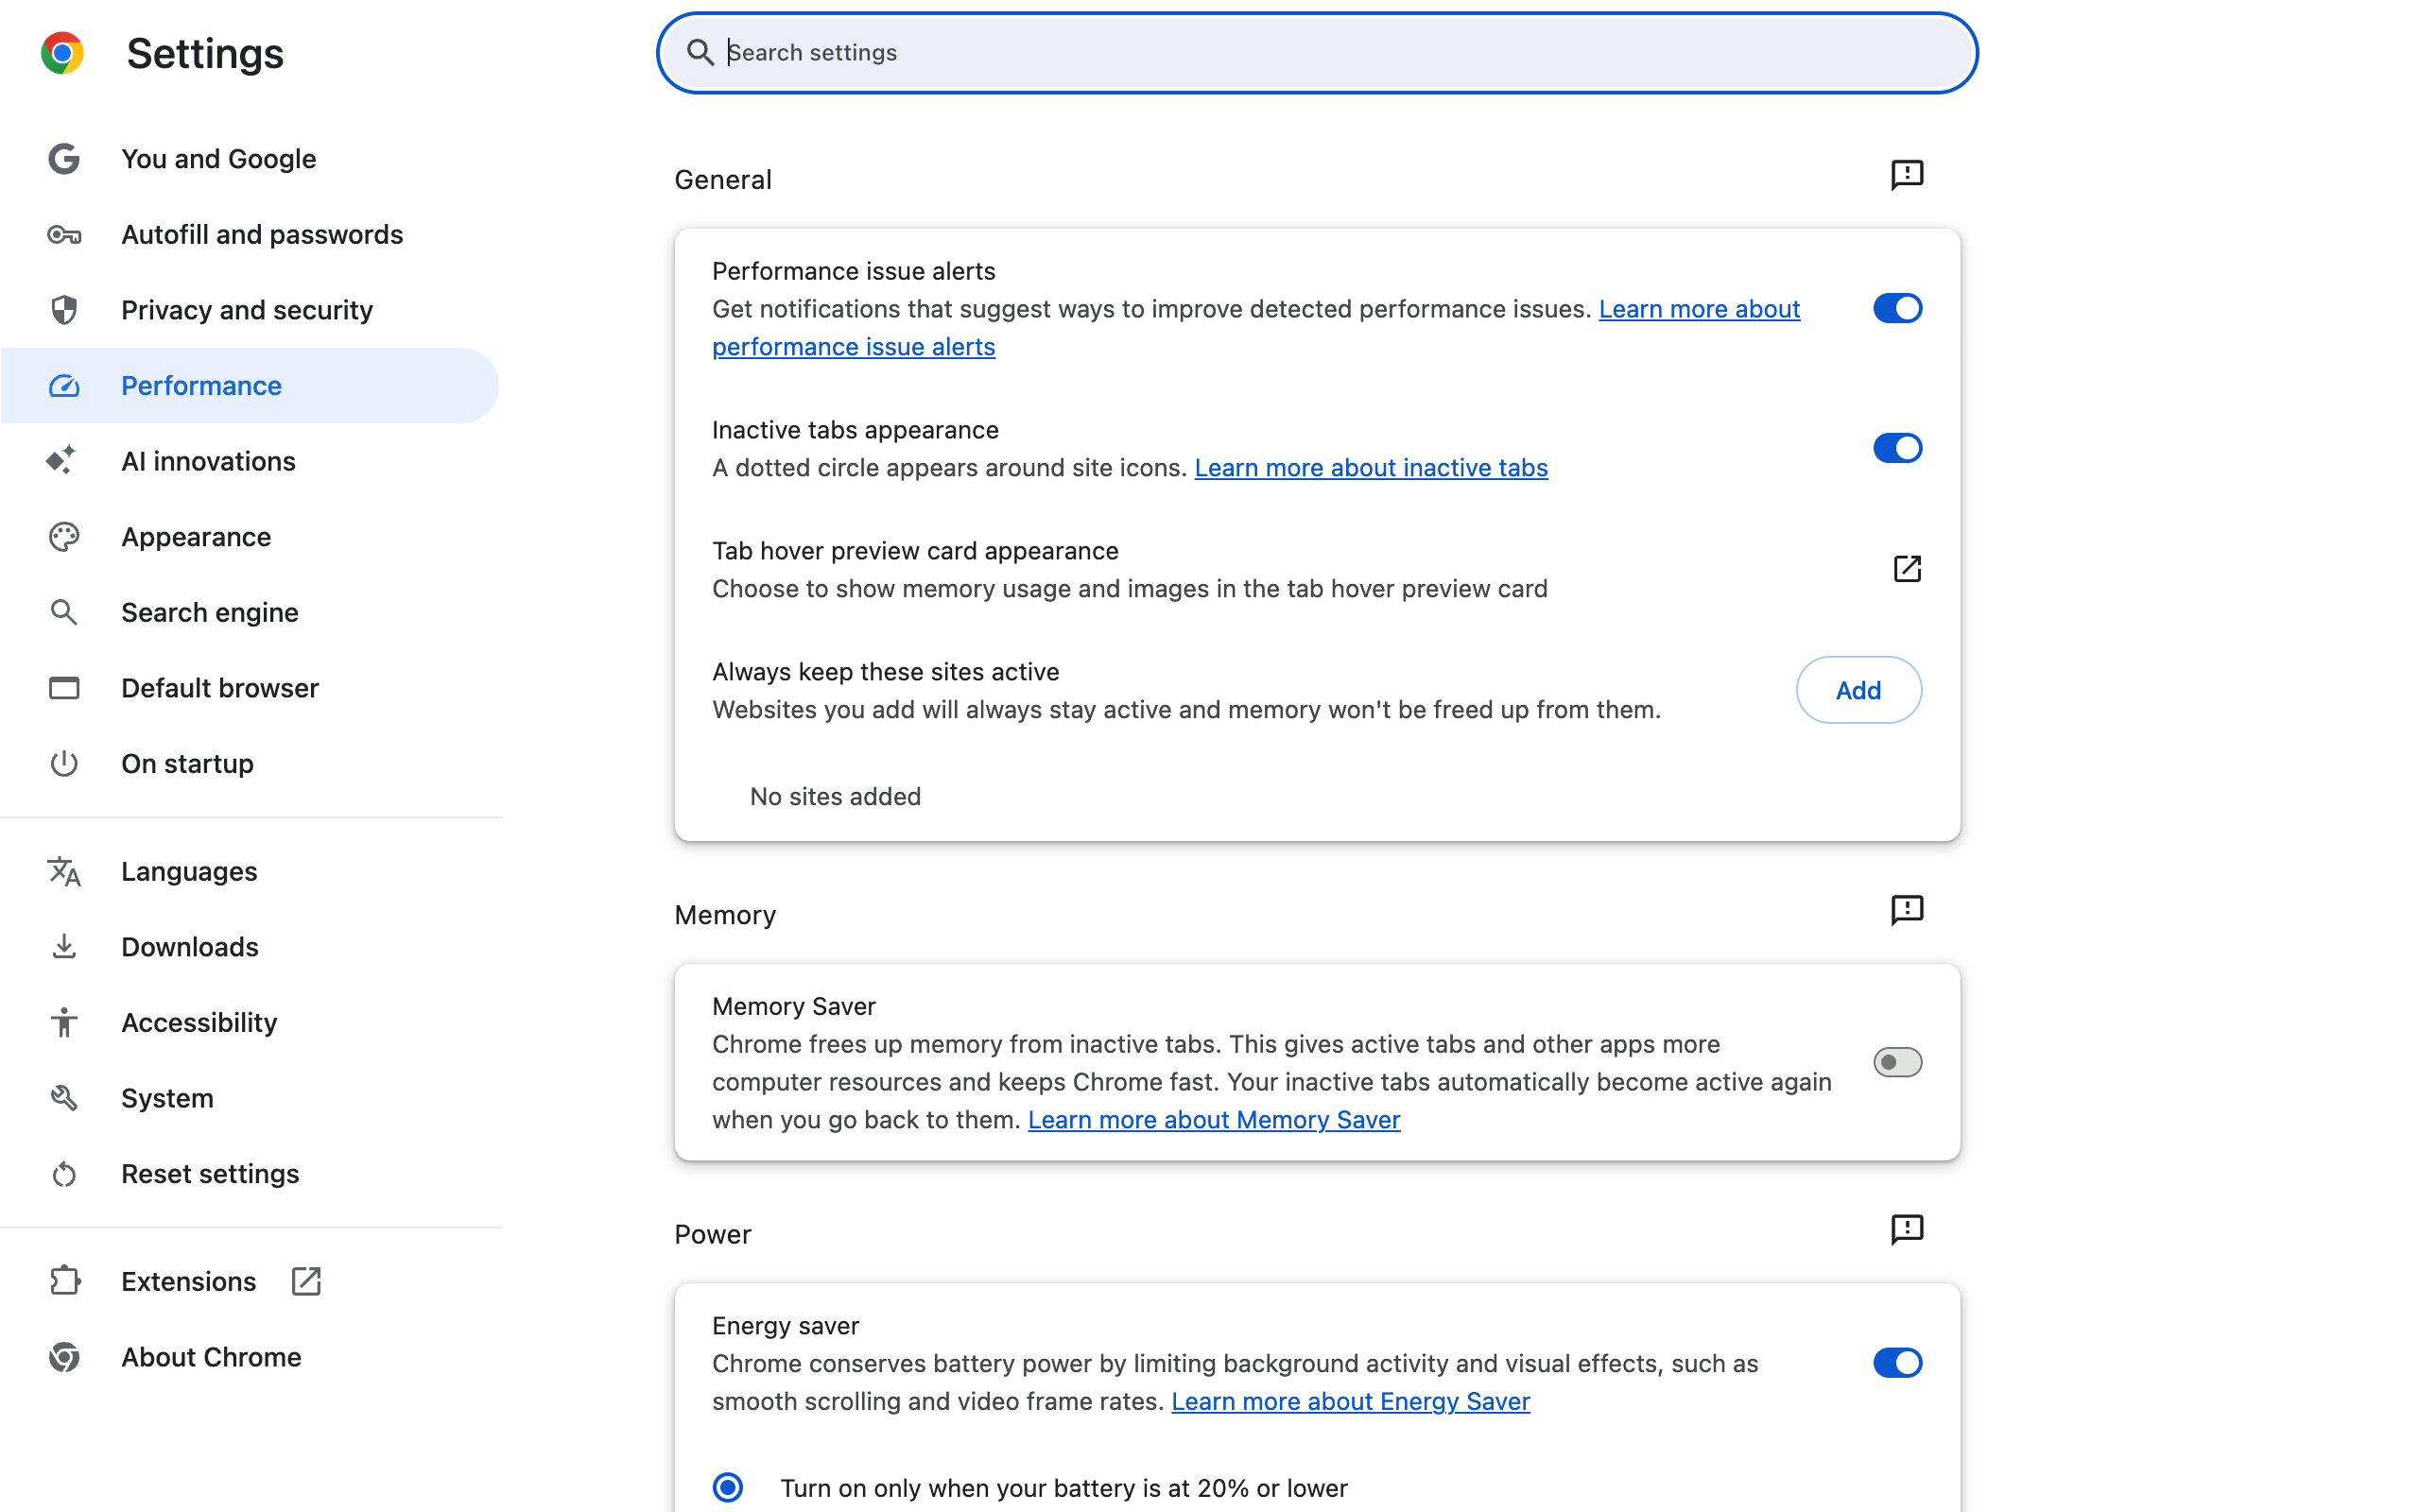
Memory Saver at chrome://settings/performance — the automatic version of discarding. It frees memory from inactive tabs and restores them when you click back. On the fresh test profile it was off by default, so check yours. The same page has a "Tab hover preview card appearance" option that adds per-tab memory usage to the hover card over each tab — a lightweight task manager you never have to open. The deep dive is in the Chrome Memory Saver guide.
DevTools Performance panel — when the culprit is a site you build or depend on, record a few seconds of the busy tab to see exactly which script is burning the CPU. The task manager tells you where; DevTools tells you why.
Do Chrome Flags Help With Lag?
Occasionally, but they are the last lever, not the first. The task manager fixes the lag you have right now; flags change how Chrome behaves in general, and most performance flags have either graduated into settings like Memory Saver or been removed. If you want to experiment anyway, the vetted list is Chrome flags useful settings. Use the task manager before and after enabling one — it is the only honest way to tell whether a flag did anything.
Chrome Task Manager vs Restarting Chrome
| Chrome task manager | Restarting Chrome | |
|---|---|---|
| Time | ~10–30 seconds | 30 seconds to minutes, plus re-logging into sites |
| What you lose | One tab or iframe's state | Every tab's in-page state, unsaved forms, scroll positions |
| Finds the cause | Yes — you see which process it was | No — the problem comes back with the tab |
| Fixes memory leaks | Yes, for the leaking process | Yes, for everything |
| Fixes a stuck Browser/GPU process | GPU: yes. Browser: no | Yes |
Restarting is the right call when the Browser process itself is the heavy row, or when Chrome has been running for days and everything is slightly bloated. For the common case — one bad tab — the task manager is faster and tells you which site to avoid next time.
Frequently Asked Questions
How do I open the Chrome task manager? Press Shift+Esc on Windows, Linux or ChromeOS (Search+Esc on a Chromebook keyboard). On any platform, including Mac, you can also open the three-dot menu, then More tools, then Task manager.
How do I use the Chrome task manager to fix lag? Sort by CPU first, not memory. A tab that sits above 20-30% CPU while you are not using it is the usual cause of lag. Select it and click End process, then reload the tab when you need it. Memory only matters once your whole system is short on RAM.
What are Subframe entries in the Chrome task manager? They are cross-site iframes, usually ads, embeds or captchas, that Chrome runs in their own process because of site isolation. In my Chrome 154 test, loading the CNN homepage took Chrome from 7 to 13 processes, including four new renderers, so the cost of one tab is often spread across several rows.
Is it safe to end a process in the Chrome task manager? Ending a tab, subframe or extension process is safe: the tab shows a crash page and comes back on reload, and an extension restarts when Chrome needs it. Unsaved form input in that tab is lost. Ending the Browser process closes Chrome entirely.
Why does Chrome show so many processes? Chrome splits work across a browser process, a GPU process, utility services such as the network and storage services, and one renderer per site. A fresh Chrome 154 with one blank tab already ran seven processes in my test, before any real page was open.
Does the Chrome task manager show memory the same way as Activity Monitor or Windows Task Manager? Not exactly. Chrome reports a per-process memory footprint, while the OS tools may group or count shared memory differently. Use Chrome task manager to compare tabs against each other, and the OS tool to see Chrome against other apps.
The Lightest Row in the List
The best extensions are the ones you never find in the task manager. Ctrl+Shift+C is built that way: it copies the current tab's URL with one shortcut, runs only when you press it, injects nothing into the pages you visit, and collects no data — so it costs you nothing while you are hunting down the tab that does.
Try Ctrl+Shift+C
Copy any URL with one keyboard shortcut. Free forever, no data collected.