DevTools Command Menu: 12 Tricks Tested on Chrome 154
The DevTools command menu is a searchable list of nearly everything DevTools can do. Press Cmd+Shift+P on Mac or Ctrl+Shift+P on Windows and Linux while DevTools is focused, type a few letters of what you want — "screenshot", "disable javascript", "dark" — and press Enter. No menus, no settings pages, no remembering which drawer a tool lives in.
Most guides mention the command menu as one tip among twenty. This one is only about the command menu. I drove a real, docked DevTools window in Chrome 154.0.8037.93 (November 2026), counted what is actually inside the menu, and tested the tricks below one by one — including a few behaviors that are not documented anywhere I could find.
Opening the Command Menu (Two Ways)
Cmd+Shift+P / Ctrl+Shift+P opens the box with a > already typed. The > matters: it tells the box to search commands.
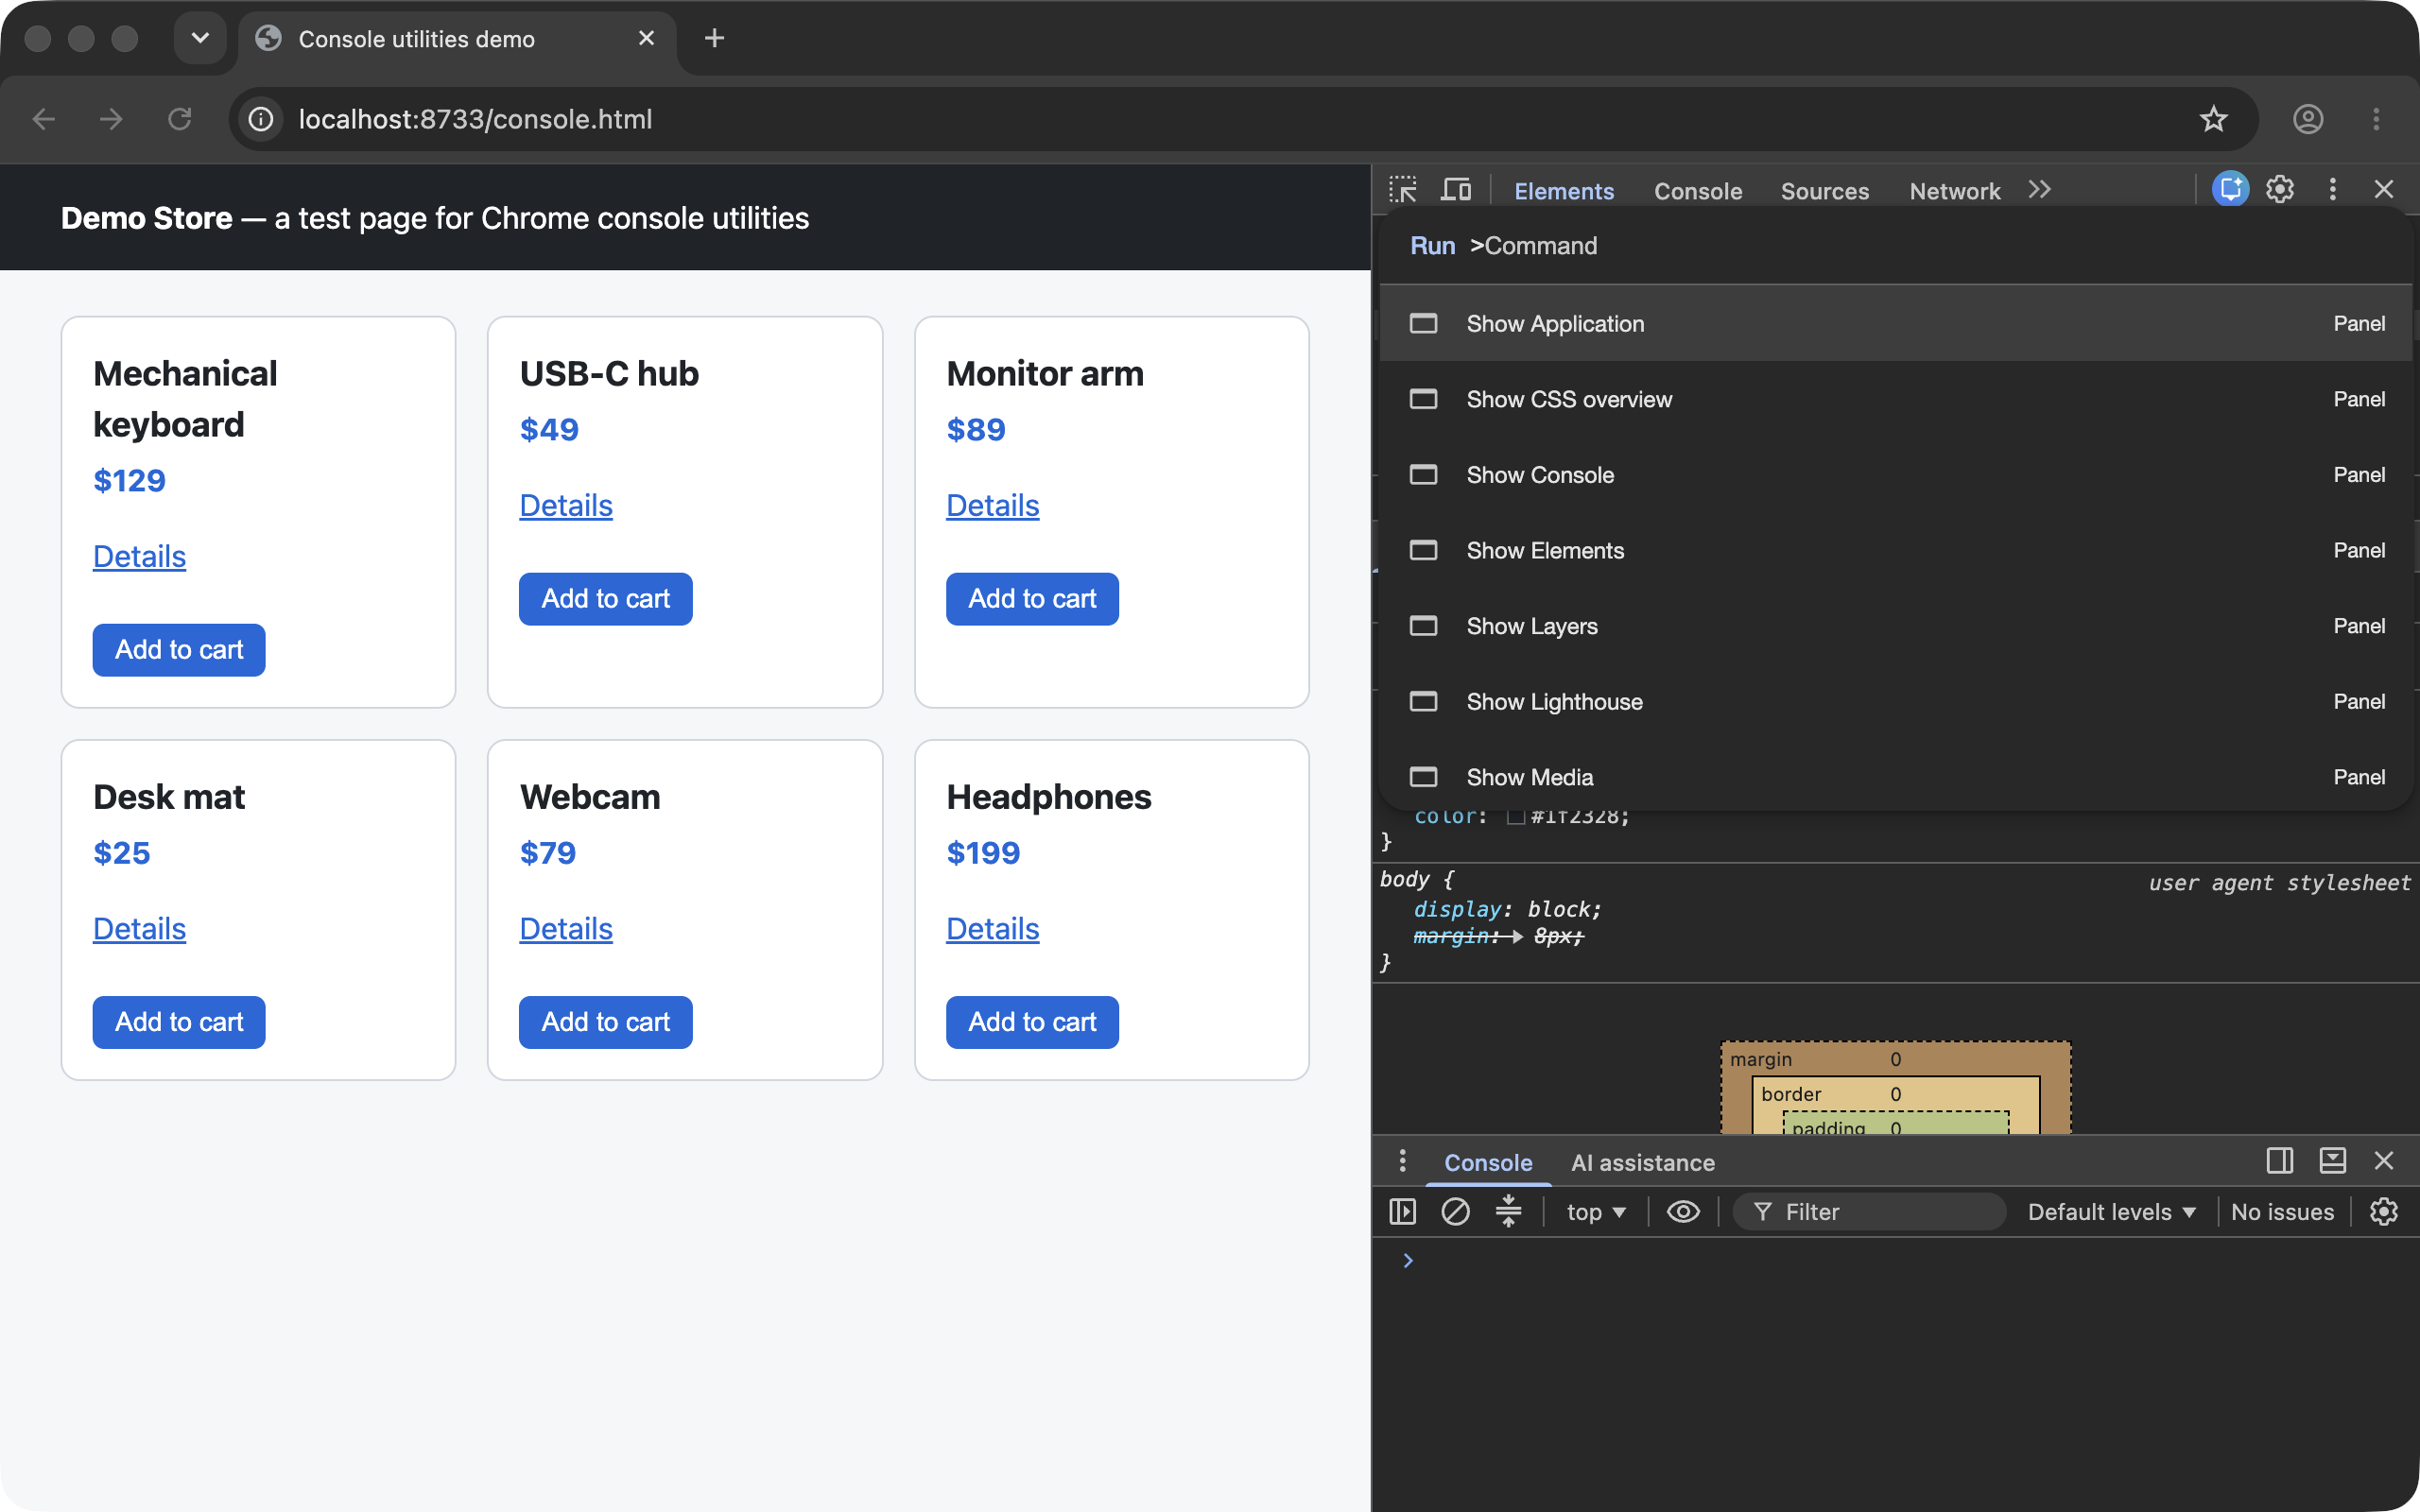
Cmd+P / Ctrl+P opens the same box without the >, which makes it a file finder. Typing console.html there found the page's source file instantly. Type > at the start of the file finder and it becomes the command menu. Once that clicks, you only need to remember Cmd+P.
One condition: DevTools must have focus. With the page focused, Cmd+P is the browser's print shortcut.
Trick 1: The Five Prefixes
Type a single ? and the box lists its modes. In Chrome 154 there are five:
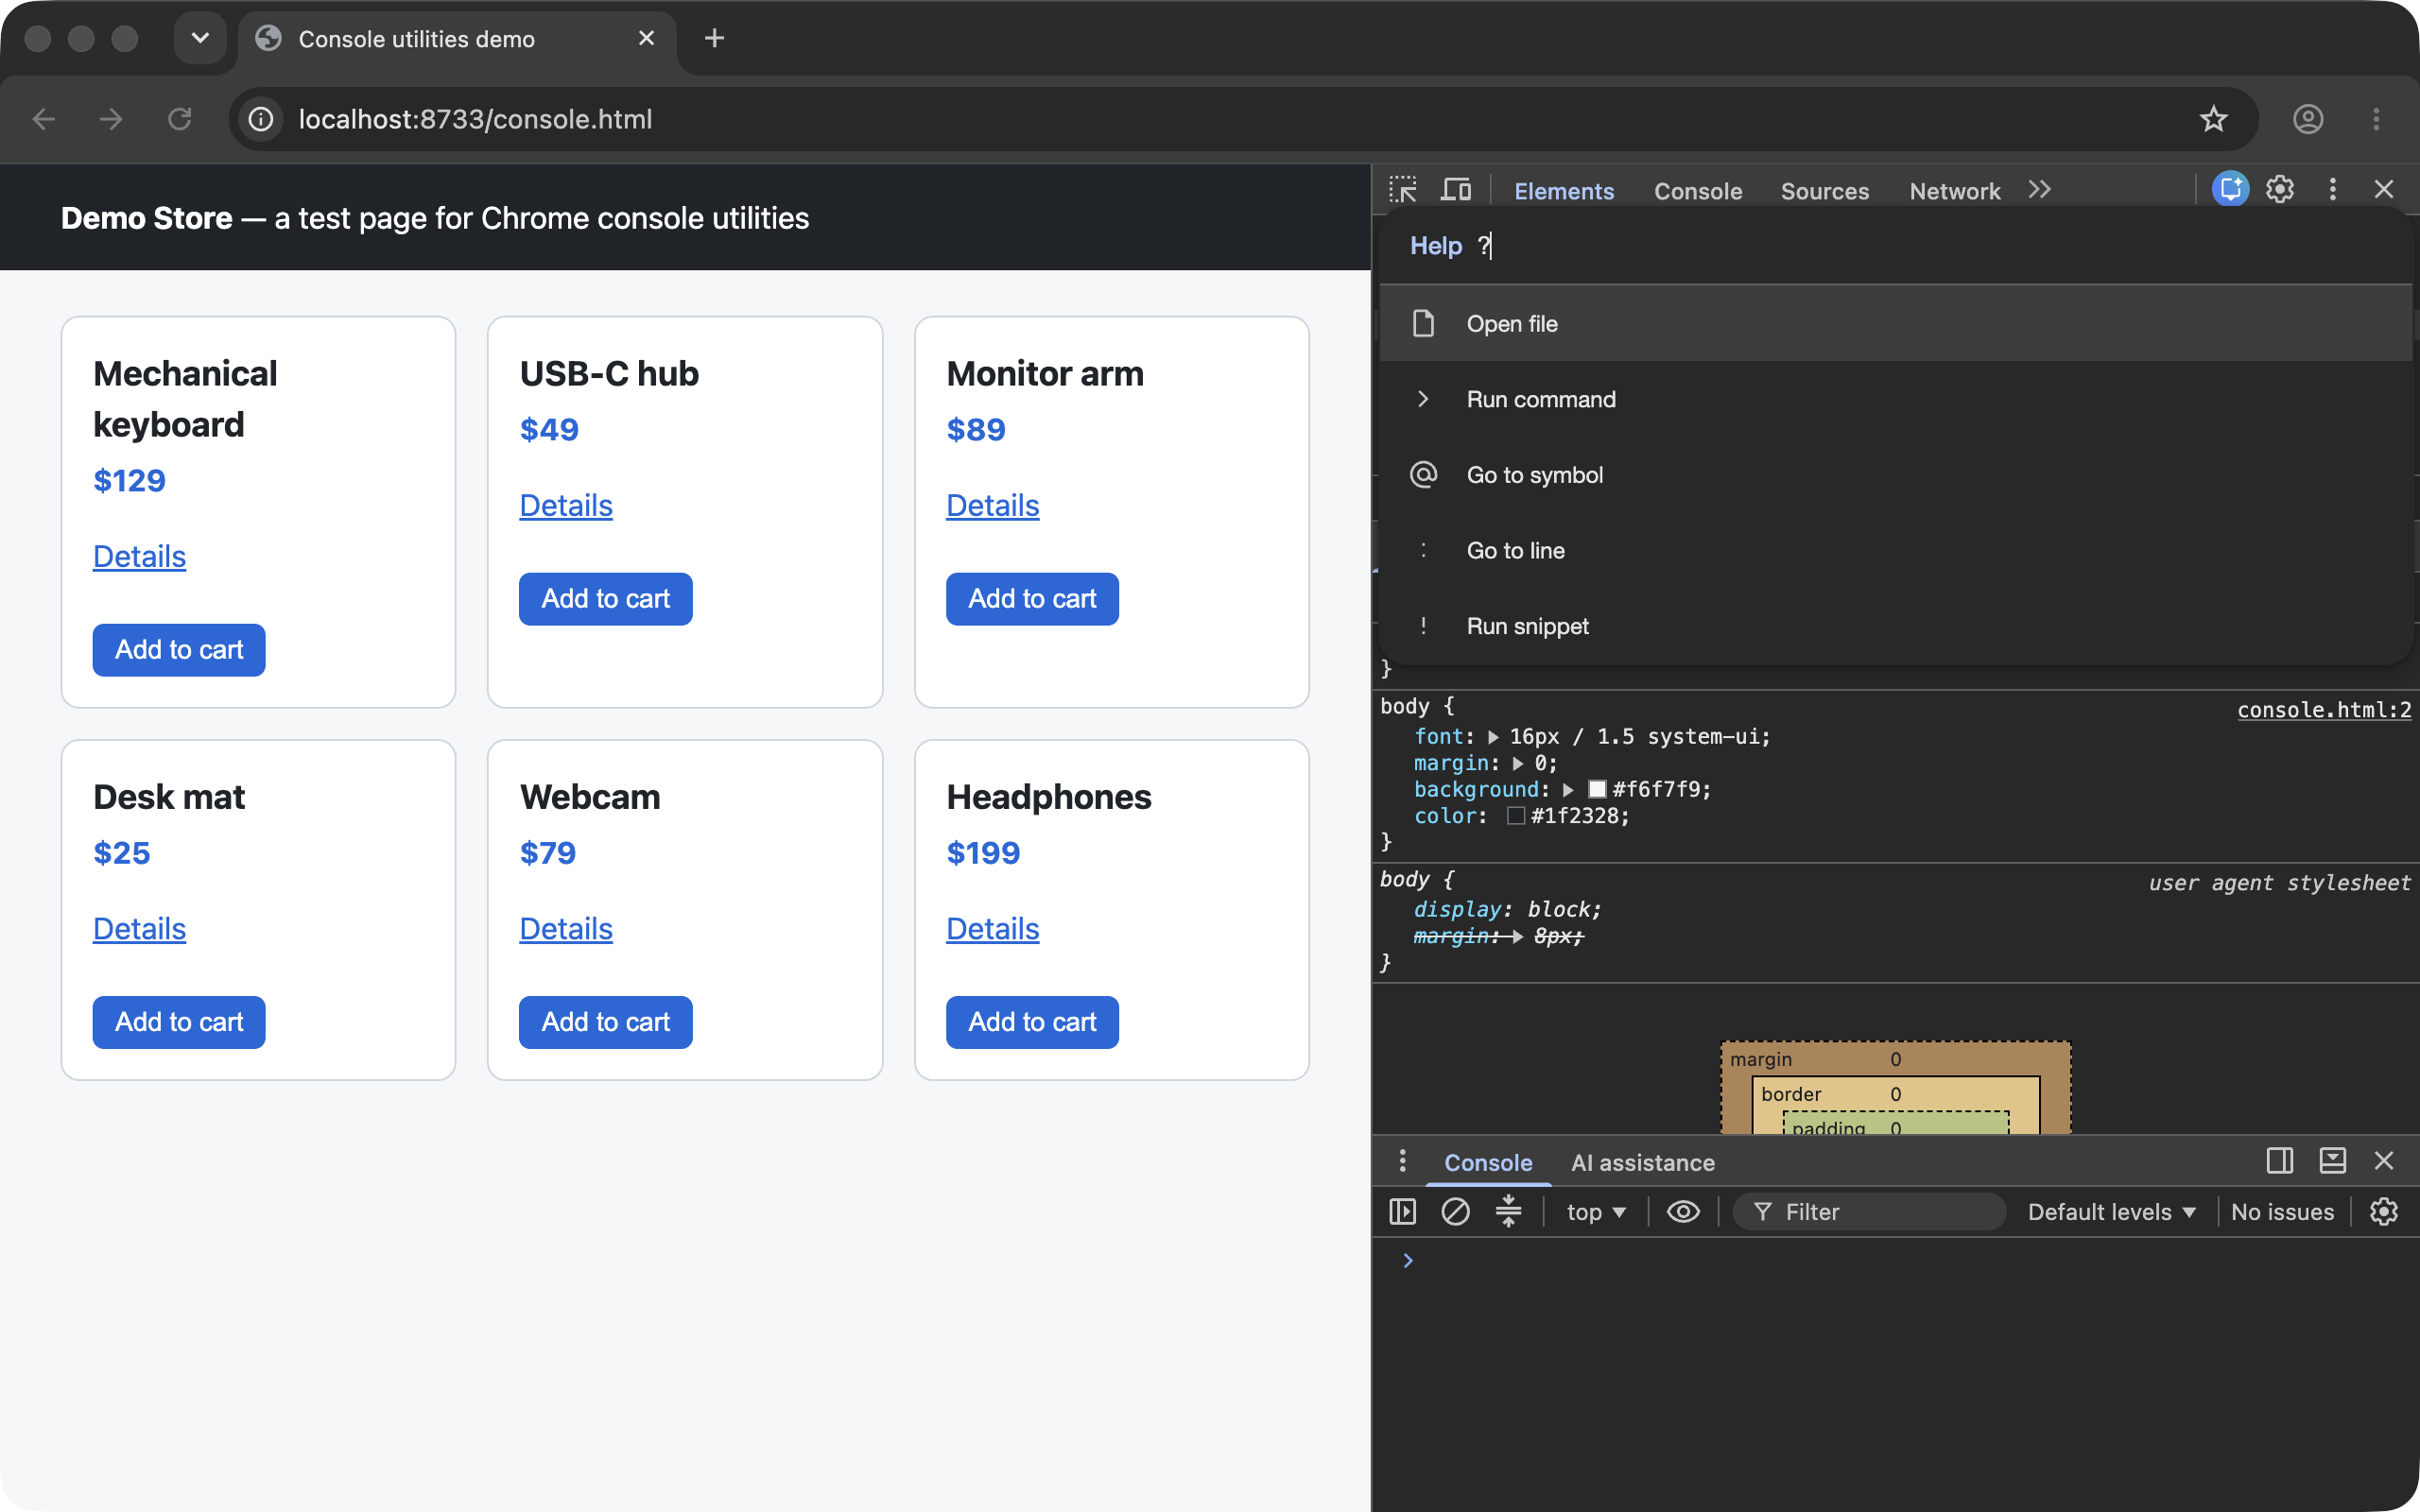
| Prefix | Mode | What I saw in Chrome 154 |
|---|---|---|
| (none) | Open file | Found console.html from its name |
> | Run command | The full command list |
@ | Go to symbol | Symbols in the open file (empty with no file open) |
: | Go to line | "Type a number to go to that line" |
! | Run snippet | Lists your saved Snippets (empty until you create one) |
? | Help | The list above |
! is the underrated one. Save any diagnostic script as a Snippet in the Sources panel once, and from then on Cmd+P, !, two letters and Enter runs it on any page. The Chrome DevTools tips and tricks guide has a few snippets worth saving.
Trick 2: Fuzzy Search Means You Can Type Less
The search is fuzzy: letters need to appear in order, not next to each other. I typed prefcol and the top two results were "Emulate CSS prefers-color-scheme: dark" and "...: light", followed by "Toggle CSS media feature prefers-color-scheme". Seven letters for a command that otherwise lives three clicks deep in the Rendering drawer.
The flip side is that short queries match loosely. dark returned eight results, the first two being "Switch to dark theme" (DevTools' own theme) and "Emulate CSS prefers-color-scheme: dark" (the page's theme) — then unrelated hits like "Disable auto closing brackets", because d-a-r-k appears in order. Read the top two results before pressing Enter; the category label on the right (Appearance vs. Rendering) tells them apart.
Trick 3: Toggles Change Their Own Names
This is the behavior I did not expect. Toggle commands are state-aware: the menu only lists the action that would change the current state.
I typed "disable javascript", pressed Enter and reloaded the test page. Its script never ran — the page still said "waiting for JS", the address bar showed the blocked-JavaScript icon and the Sources tab gained a warning triangle. Then I opened the menu again and typed "javascript":
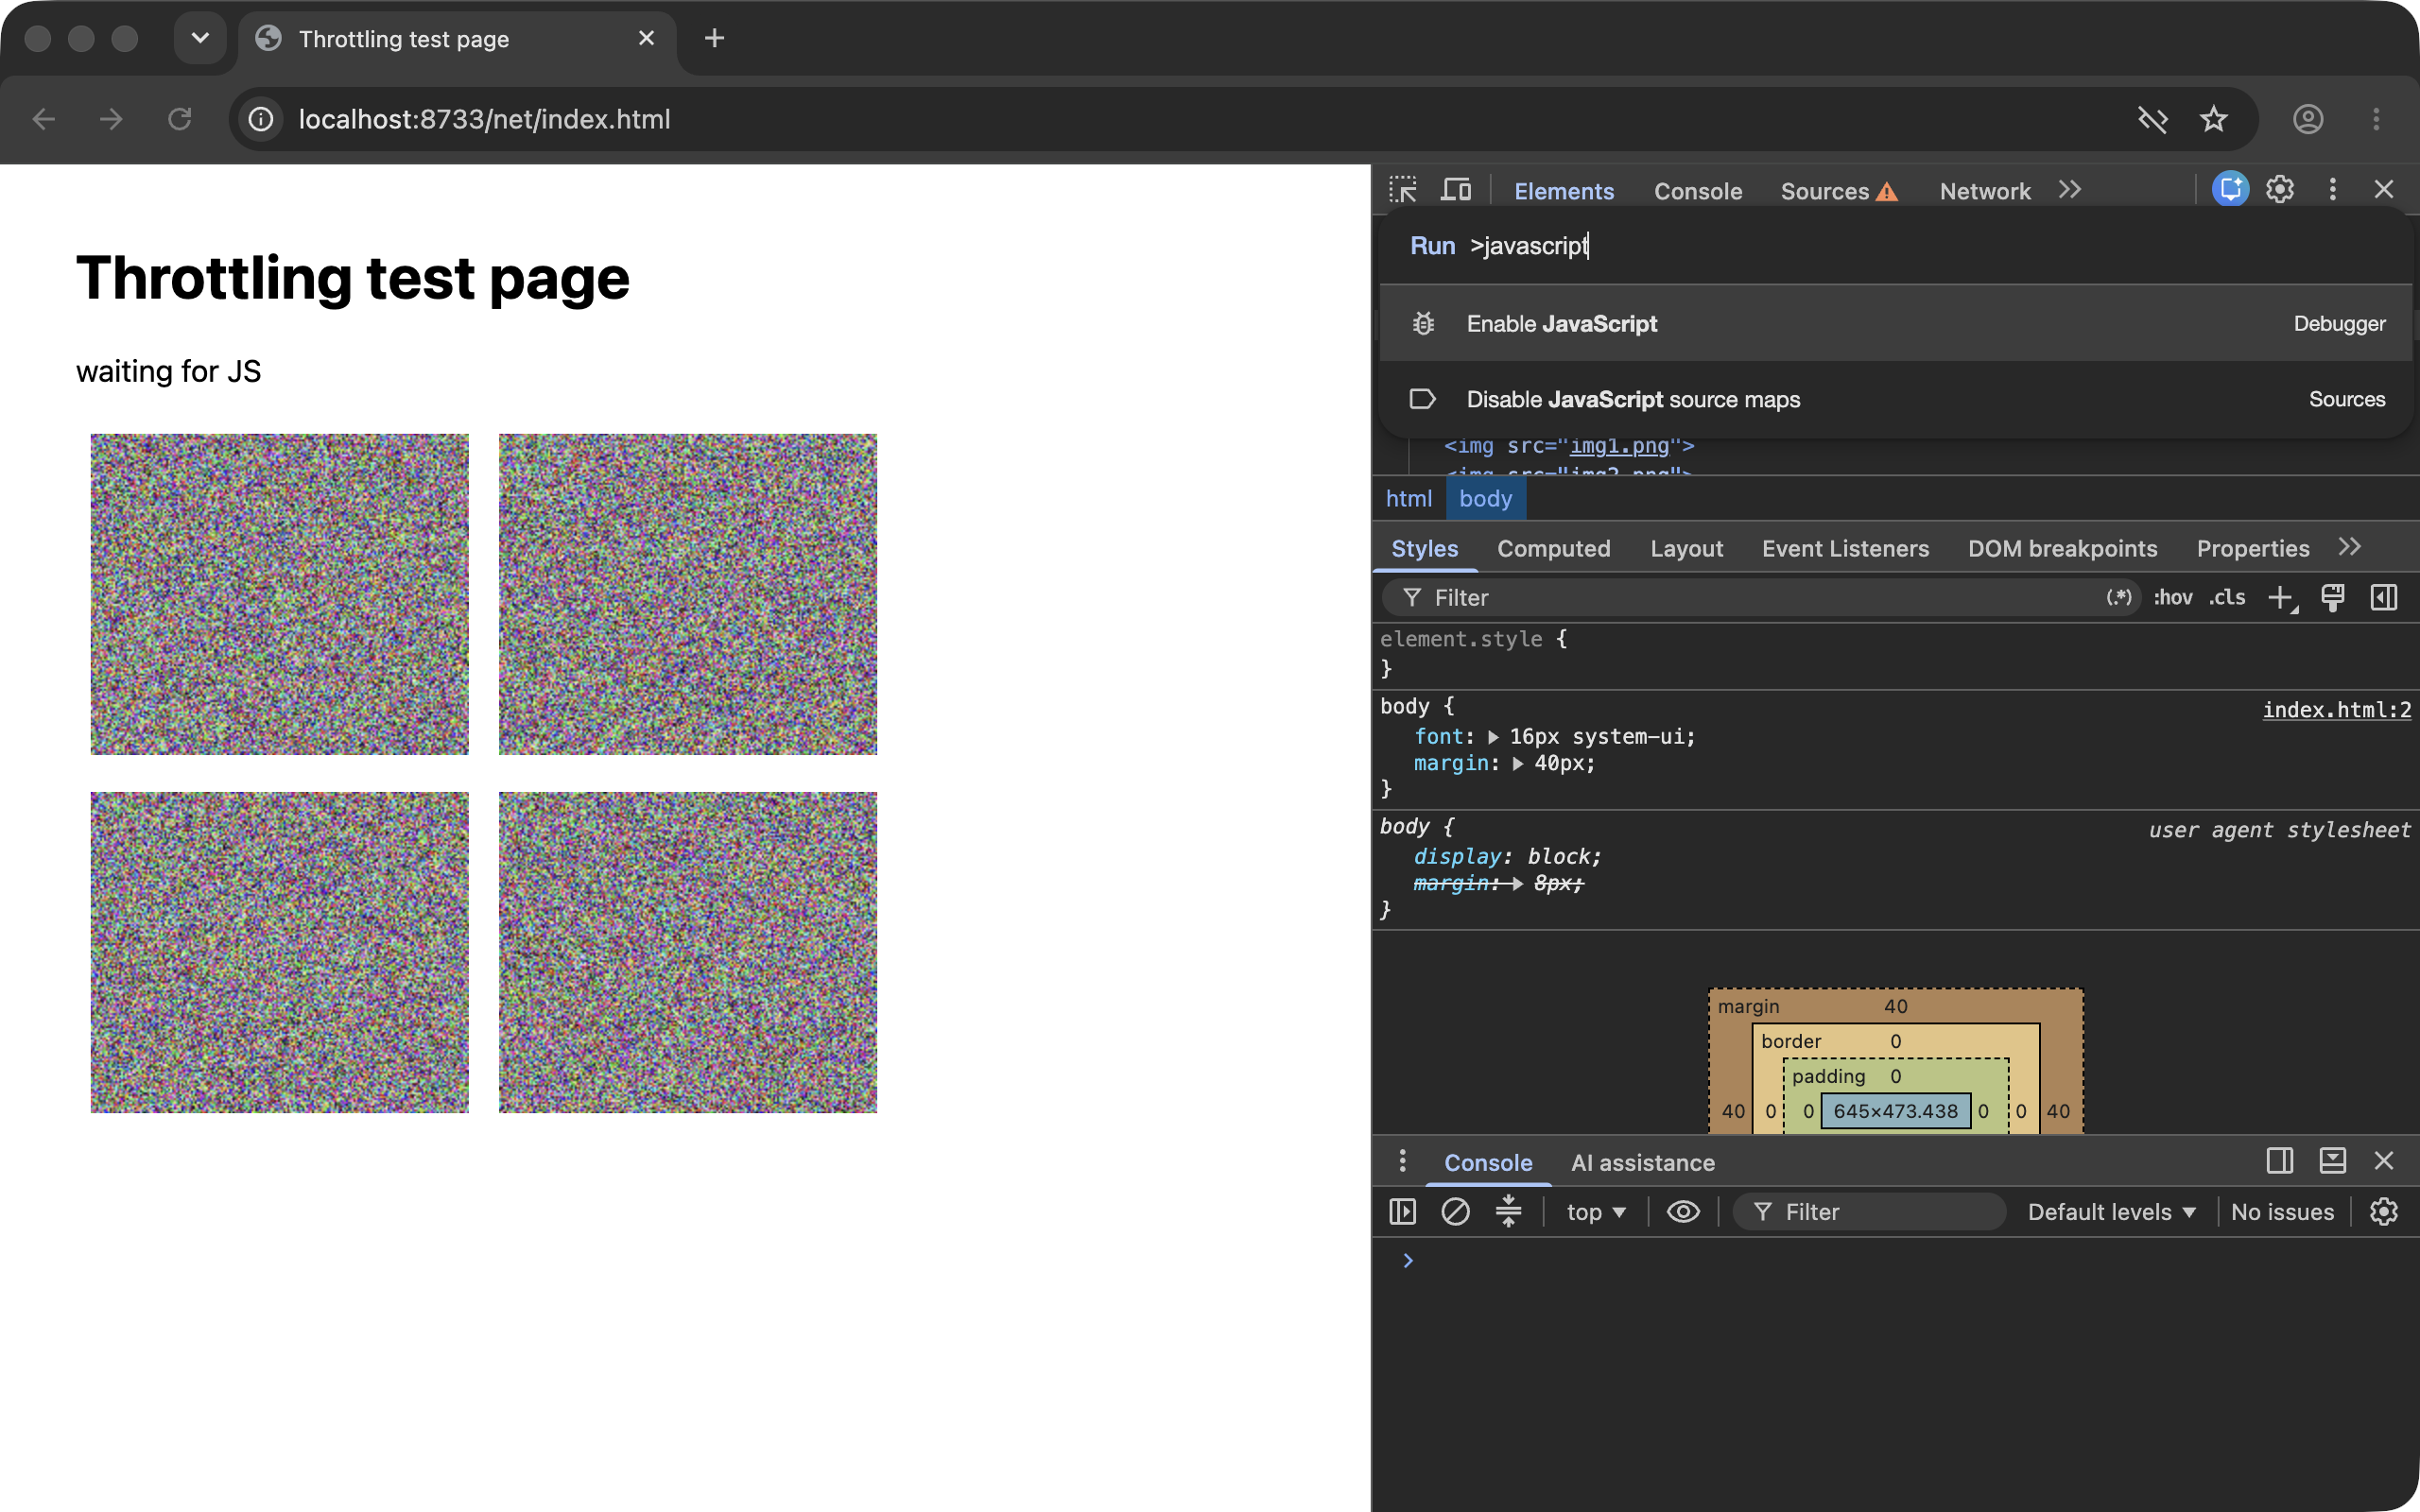
"Disable JavaScript" was gone, replaced by "Enable JavaScript". Running it and reloading brought the page back to "JS loaded". In my count, 76 commands are hidden at any moment for exactly this reason — they are the other half of an on/off pair. It doubles as a status check: if the menu offers "Enable cache", your cache is currently disabled.
Trick 4: Four Screenshot Commands (Usually)
Type screenshot and you get four commands:
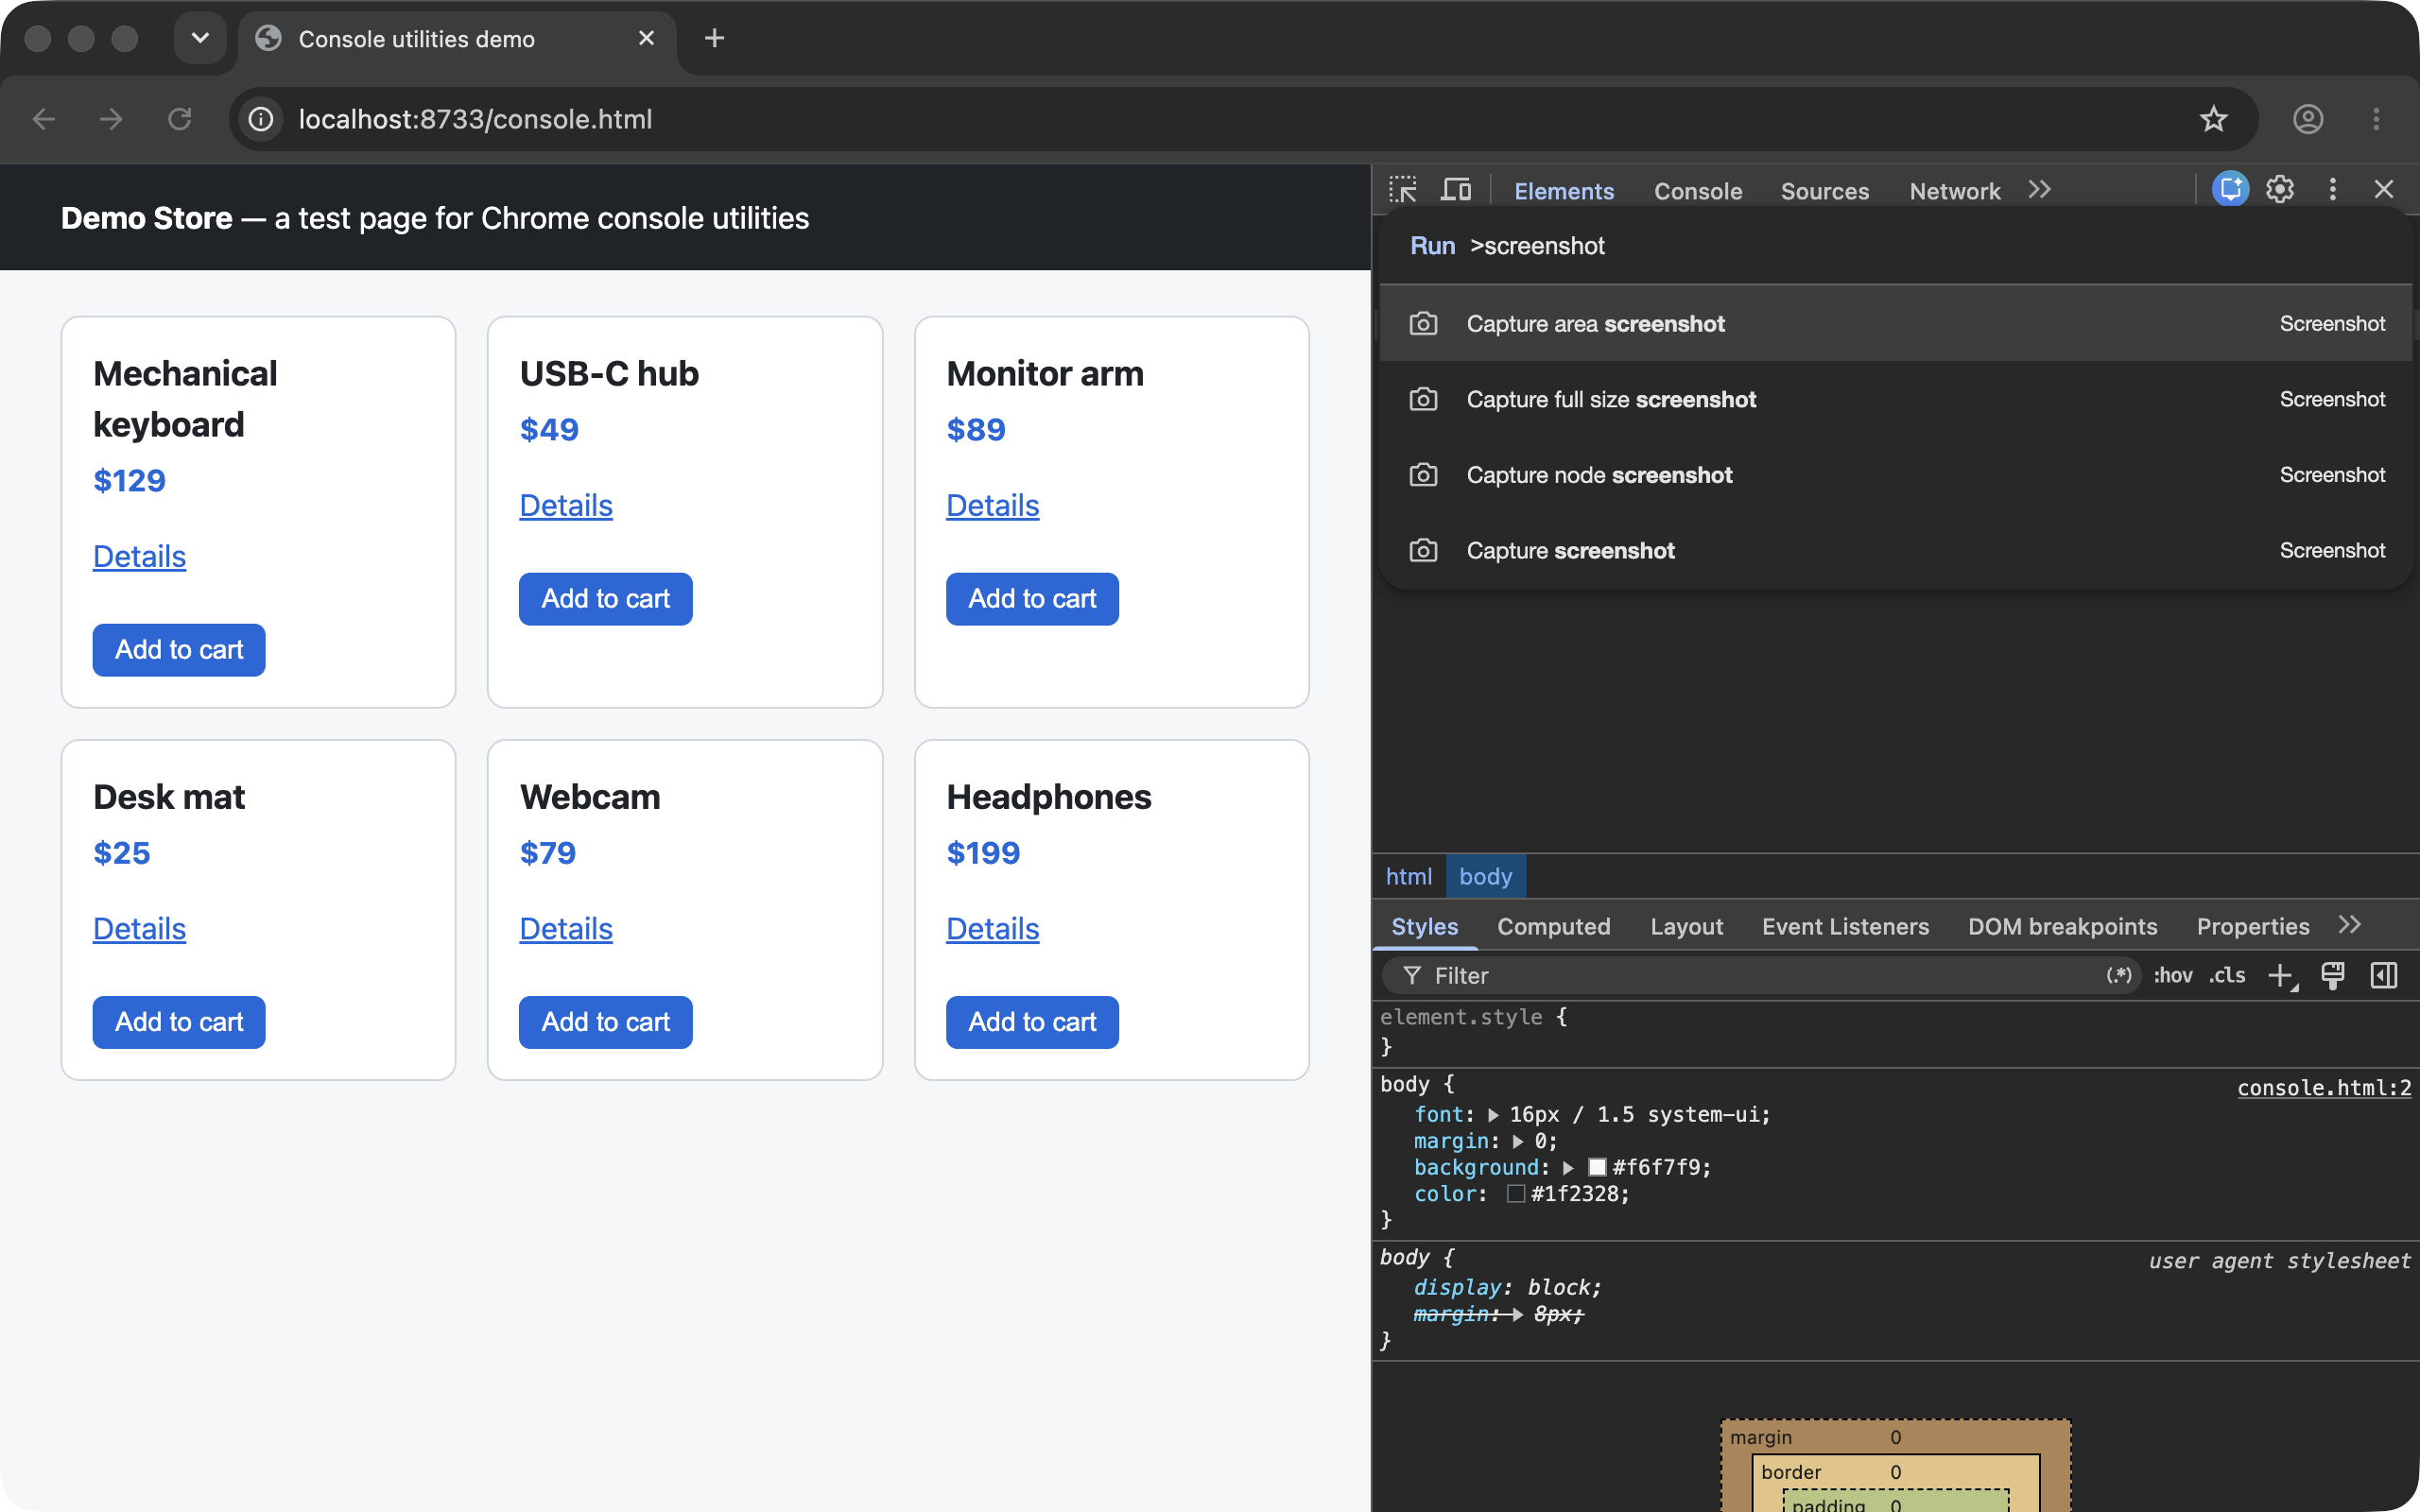
- Capture screenshot — the visible viewport.
- Capture full size screenshot — the entire scrollable page, no stitching.
- Capture node screenshot — just the element selected in the Elements panel.
- Capture area screenshot — drag a rectangle.
The caveat I ran into: these four only exist when DevTools is able to dock to the page. When I connected DevTools to the same page remotely — the way you would with remote debugging — the same search returned "No commands found". The DevTools source registers all four with a "can dock" condition. If they are missing for you, that is why; the node version is still available by right-clicking an element in the Elements tree.
Tricks 5–8: Emulation Commands Worth Memorizing
The Rendering category alone has 63 commands, and they are the ones I use most because their normal home, the Rendering drawer, is buried.
5. Color scheme and motion. "Emulate CSS prefers-color-scheme: dark" and "Emulate CSS prefers-reduced-motion: reduce" test dark mode and reduced-motion styles without touching OS settings. "Emulate CSS forced-colors: active" approximates Windows high-contrast mode.
6. Vision deficiencies. Six commands: blurred vision, reduced contrast, protanopia, deuteranopia, tritanopia and achromatopsia. Type part of the name — deuter, tritan — to find each one. Running each against your palette is a five-minute accessibility check.
7. OS text scale. Ten size commands, from 85% to 350%, emulate a user's operating-system text size setting — a quick way to see which layouts break at large text.
8. Emulate a focused page. Keeps the page acting focused while you click around DevTools, so menus that close on blur stay open. Type focused. It pairs with forcing :hover and :focus states, covered in the force element state guide.
Tricks 9–11: Drawers, Docking and Settings Without the Settings Page
9. Open any drawer tool by name. Chrome 154 lists 19 "Show …" drawer commands, including Coverage, Animations, Changes, Performance monitor, Sensors, Network conditions, request conditions and Memory inspector. "Show Coverage" via >show cov is two words instead of a trip through the More tools menu. For the network ones, the DevTools network throttling guide shows what to do once they are open.
10. Move DevTools. "Dock to bottom", "Dock to left" and "Undock into separate window" — whichever is not your current position is listed.
11. Flip settings in one step. "Show timestamps" in the console, "Keep log on page reload / navigation", "Disable cache while DevTools is open", "Show rulers on hover", "Auto-open DevTools for popups". Each of these is otherwise a checkbox on a settings page.
Trick 12: Disable Image Formats and Local Fonts
Four lesser-known Rendering commands answer "what does my page look like when …":
- Disable AVIF format, Disable WebP format and Disable JPEG XL format make Chrome act as if it does not support that format, so you can confirm your
<picture>fallbacks actually work. - Disable local fonts ignores fonts installed on your machine, revealing whether your web fonts load or you have just been seeing your own copy.
None of these has a keyboard shortcut. All of them are a few letters away in the command menu.
What Is Actually in the Menu: A Count
I counted the registered setting and view commands from inside DevTools in Chrome 154. The total was 320, split like this:
| Category | Commands | Notable examples |
|---|---|---|
| Appearance | 93 | 82 DevTools UI languages, light/dark theme, panel layout |
| Rendering | 63 | Color scheme, vision deficiencies, text scale, paint flashing |
| Sources | 47 | Indentation, source maps, whitespace, pretty printing |
| Console | 22 | Timestamps, network messages, autocomplete |
| Drawer | 19 | Coverage, Animations, Changes, request conditions |
| Network | 15 | Disable cache, keep log, request blocking |
| Panel | 13 | Show Elements, Console, Network, Lighthouse… |
| Settings, Grid, Elements | 9 each | Shortcuts, grid overlays, rulers |
| Global | 8 | Docking, auto-open for popups |
| Debugger | 6 | Disable JavaScript, pause on exceptions |
| Mobile, Persistence, Performance | 4, 2, 2 | Media queries, overrides |
Two adjustments make that number honest. 76 of the 320 are hidden at any moment (the other side of a toggle), and 82 are language choices. That leaves roughly 160 useful commands visible at once — plus action commands such as the four screenshot captures, which are registered separately and were not in this count.
A Two-Minute Practice Routine
The command menu only pays off once it is a reflex. Run this sequence once a day for a week:
Cmd+Shift+P→screenshot→ Capture full size screenshot.Cmd+Shift+P→prefcol→ Emulate dark, then light again.Cmd+Shift+P→disable javascript, reload, thenenable javascript.Cmd+P→ part of a file name → Enter.Cmd+P→?→ read the five modes once more.
After that the DevTools keyboard shortcuts list is mostly optional: anything without a shortcut is in the menu.
Frequently Asked Questions
How do I open the command menu in Chrome DevTools? With DevTools focused, press Cmd+Shift+P on Mac or Ctrl+Shift+P on Windows and Linux. The menu opens with a > prefix, which means it is searching commands. Pressing Cmd+P or Ctrl+P opens the same box without the prefix, searching files instead.
What do the prefixes in the DevTools command menu do? In Chrome 154 there are five, listed when you type a question mark: no prefix opens a file, > runs a command, @ goes to a symbol in the current file, : goes to a line number, and ! runs a saved snippet.
How many commands does the DevTools command menu have? In my Chrome 154 count, 320 setting and view commands were registered, 76 of them hidden at any moment because they are the opposite side of a toggle, and 82 of them were UI language choices. Action commands such as the four screenshot commands come on top of that.
Why are the screenshot commands missing from my command menu? The Capture screenshot commands only register when DevTools can dock to the page, which is the normal case. When DevTools is connected remotely, for example through remote debugging, typing screenshot returns No commands found.
Does the command menu use fuzzy search? Yes. Letters only need to appear in order, not next to each other. Typing prefcol in Chrome 154 found Emulate CSS prefers-color-scheme: dark and light as the top results.
Why does the command menu say Enable JavaScript instead of Disable JavaScript? Toggle commands are state-aware. Only the action that would change the current state is listed, so once JavaScript is disabled the menu offers Enable JavaScript. The same applies to cache, timestamps, rulers and other on/off settings.
The command menu is DevTools' version of "one shortcut, then type what you want". The browser itself has a gap in that model: copying the current tab's URL still takes a click into the address bar. Ctrl+Shift+C closes it — one keystroke from any tab, URL on the clipboard, no data collected.
Try Ctrl+Shift+C
Copy any URL with one keyboard shortcut. Free forever, no data collected.