The debugger Statement in Chrome: JavaScript Guide (2026)
The JavaScript debugger statement is a breakpoint you type into your code. Put debugger; on a line, open Chrome DevTools, trigger the code, and Chrome stops on that exact line in the Sources panel with the call stack, local variables and the console all pointed at the paused moment. With DevTools closed, the statement is ignored and the code runs as if it were not there.
That is the whole contract. What the docs leave out is everything around it: why it sometimes refuses to pause, how to silence a debugger you cannot delete (the classic "this site keeps pausing my DevTools" problem), and what it costs to leave one in a hot path. I tested all of it in Chrome 156.0.8078.48 (October 2026) on a small checkout demo, driving the real DevTools frontend through the Chrome DevTools Protocol, so every number below is something I measured rather than repeated.
How the debugger Statement Works in Chrome
Here is the demo code. calcTotal adds up a cart and then hits a debugger statement before returning:
function calcTotal(items) {
  let total = 0;
  for (const item of items) {
    total += item.price * item.qty;
  }
  debugger;
  return total;
}
With DevTools open on the Sources panel, clicking "Add to cart" paused execution on line 7. The yellow "Debugger paused" banner appears, the line is highlighted, and DevTools shows inline values right in the editor: items = [{…}], total = 39.98.
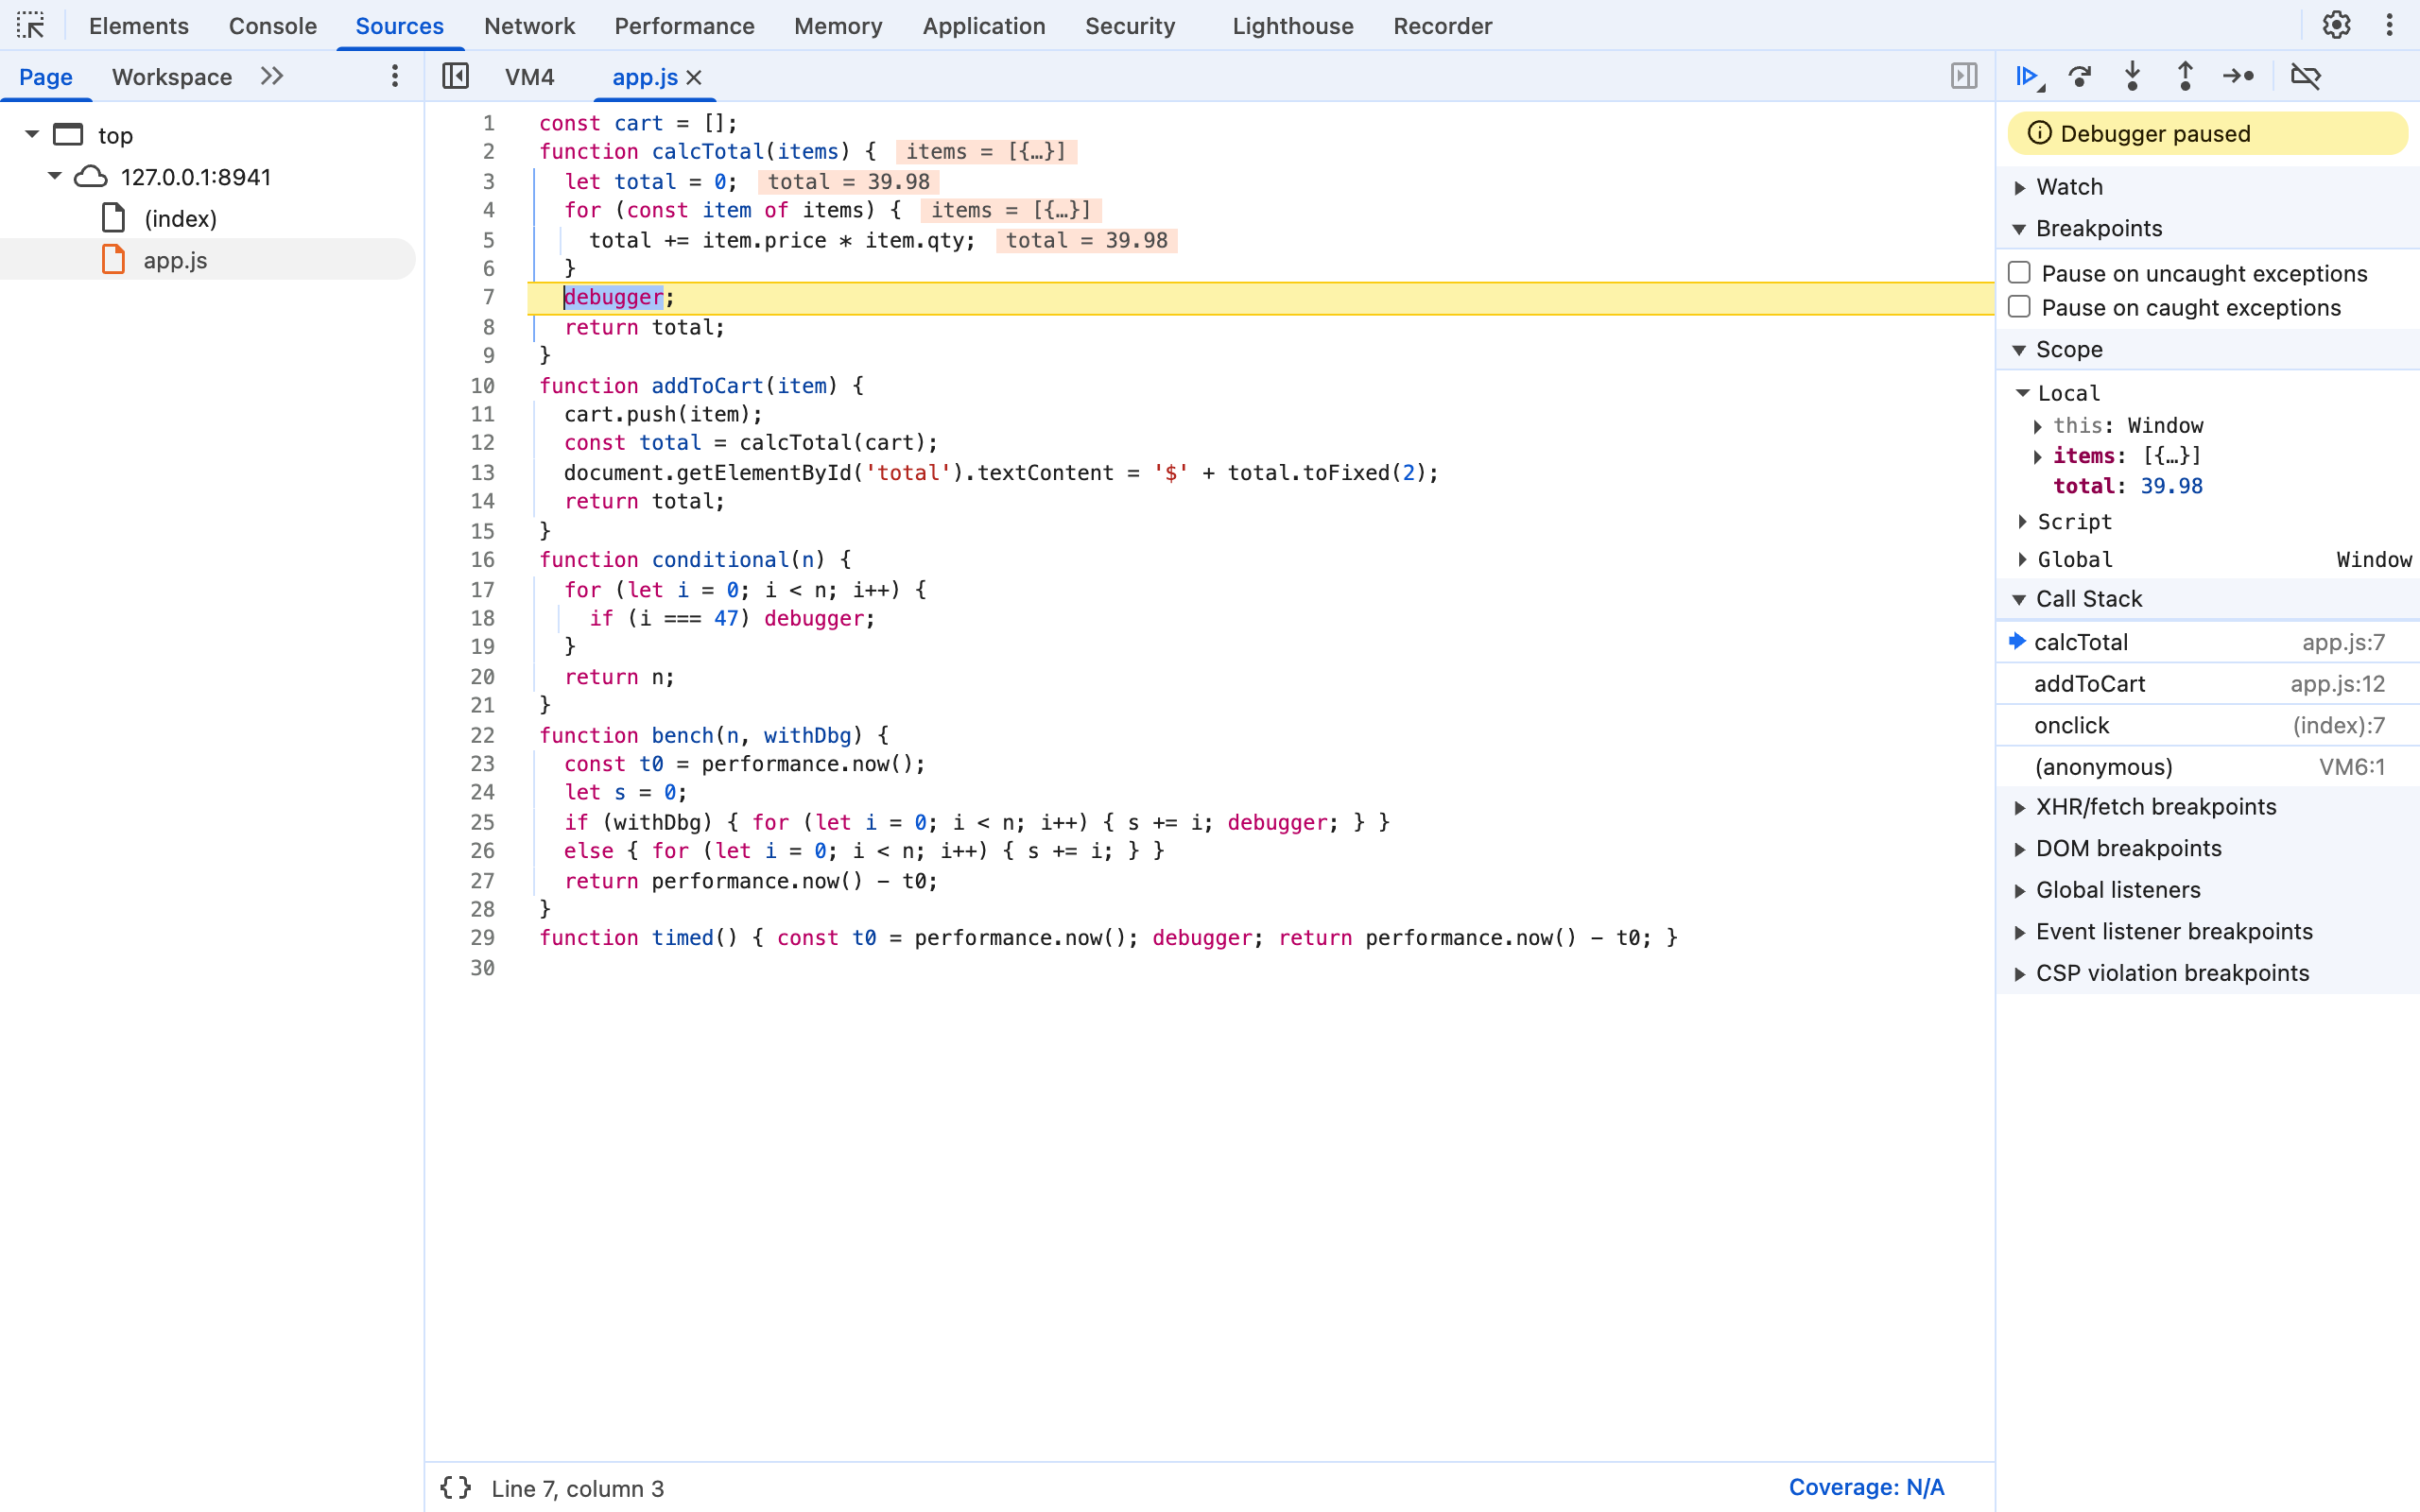
Three things in that screenshot do most of the work:
- Scope lists every variable in reach:
Local(items,total),ScriptandGlobal. You can edit values here before resuming. - Call Stack shows how you got here:
calcTotal←addToCart←onclick. Clicking a frame jumps to it and switches the Scope pane to that frame's variables. - The page is frozen. The cart total on the page still read
$0.00, because the line that writes it (addToCart, line 13) had not run yet.
Under the hood, the pause is reported over the DevTools Protocol as a Debugger.paused event with the reason other. That is worth knowing if you automate Chrome: a stray debugger only stops execution for a client that has enabled the Debugger domain on that page. My scripted runs that never enabled it went straight past every debugger line.
When It Pauses and When Chrome Ignores It
The rule is simple: the debugger statement in JavaScript pauses only when a debugger is attached to that tab and breakpoints are active. I checked each case directly.
| Situation | Paused? | What I measured on Chrome 156 |
|---|---|---|
| DevTools closed (no debugger attached) | No | timed() around a debugger returned 0 ms |
| DevTools open, defaults | Yes | Paused on line 7, reason other |
| DevTools open, breakpoints deactivated | No | Ran straight through |
| "Never pause here" on that line | No | Ran straight through, page total updated |
if (i === 47) debugger; in a 100-step loop | Once | Paused with i = 47 in the Scope pane |
| DevTools open in a different tab | No | A 10M-iteration loop full of debugger ran through in ~140 ms |
The last row trips people up: opening DevTools on one tab and then reproducing the bug in another means nothing pauses. DevTools has to be open in the tab running the code. If you need to catch something during page load, open DevTools first and then reload.
Debugger Controls and Shortcuts
Once paused, you drive execution from the toolbar above the Scope pane. I read the shortcuts straight from the tooltips in Chrome 156 on macOS; the Windows and Linux equivalents use Ctrl in place of Cmd.
| Action | Mac | Windows / Linux |
|---|---|---|
| Resume script execution | F8 or Cmd+\ | F8 or Ctrl+\ |
| Step over next function call | F10 or Cmd+' | F10 or Ctrl+' |
| Step into next function call | F11 or Cmd+; | F11 or Ctrl+; |
| Step out of current function | Shift+F11 or Cmd+Shift+; | Shift+F11 or Ctrl+Shift+; |
| Step | F9 | F9 |
| Deactivate breakpoints | Cmd+F8 | Ctrl+F8 |
The F-key versions are the same everywhere, which makes them worth learning first. The full list of DevTools keys is in the Chrome DevTools keyboard shortcuts post, and most of these actions are also one search away in the DevTools command menu.
Conditional debugger: Pause Only on the Case You Care About
A plain debugger inside a loop pauses on every iteration, which is useless after the third one. Wrap it in a condition instead:
for (let i = 0; i < n; i++) {
  if (i === 47) debugger;
}
Called with n = 100, Chrome paused exactly once, and the Scope pane showed i: 47 in the Block scope and n: 100 in Local:
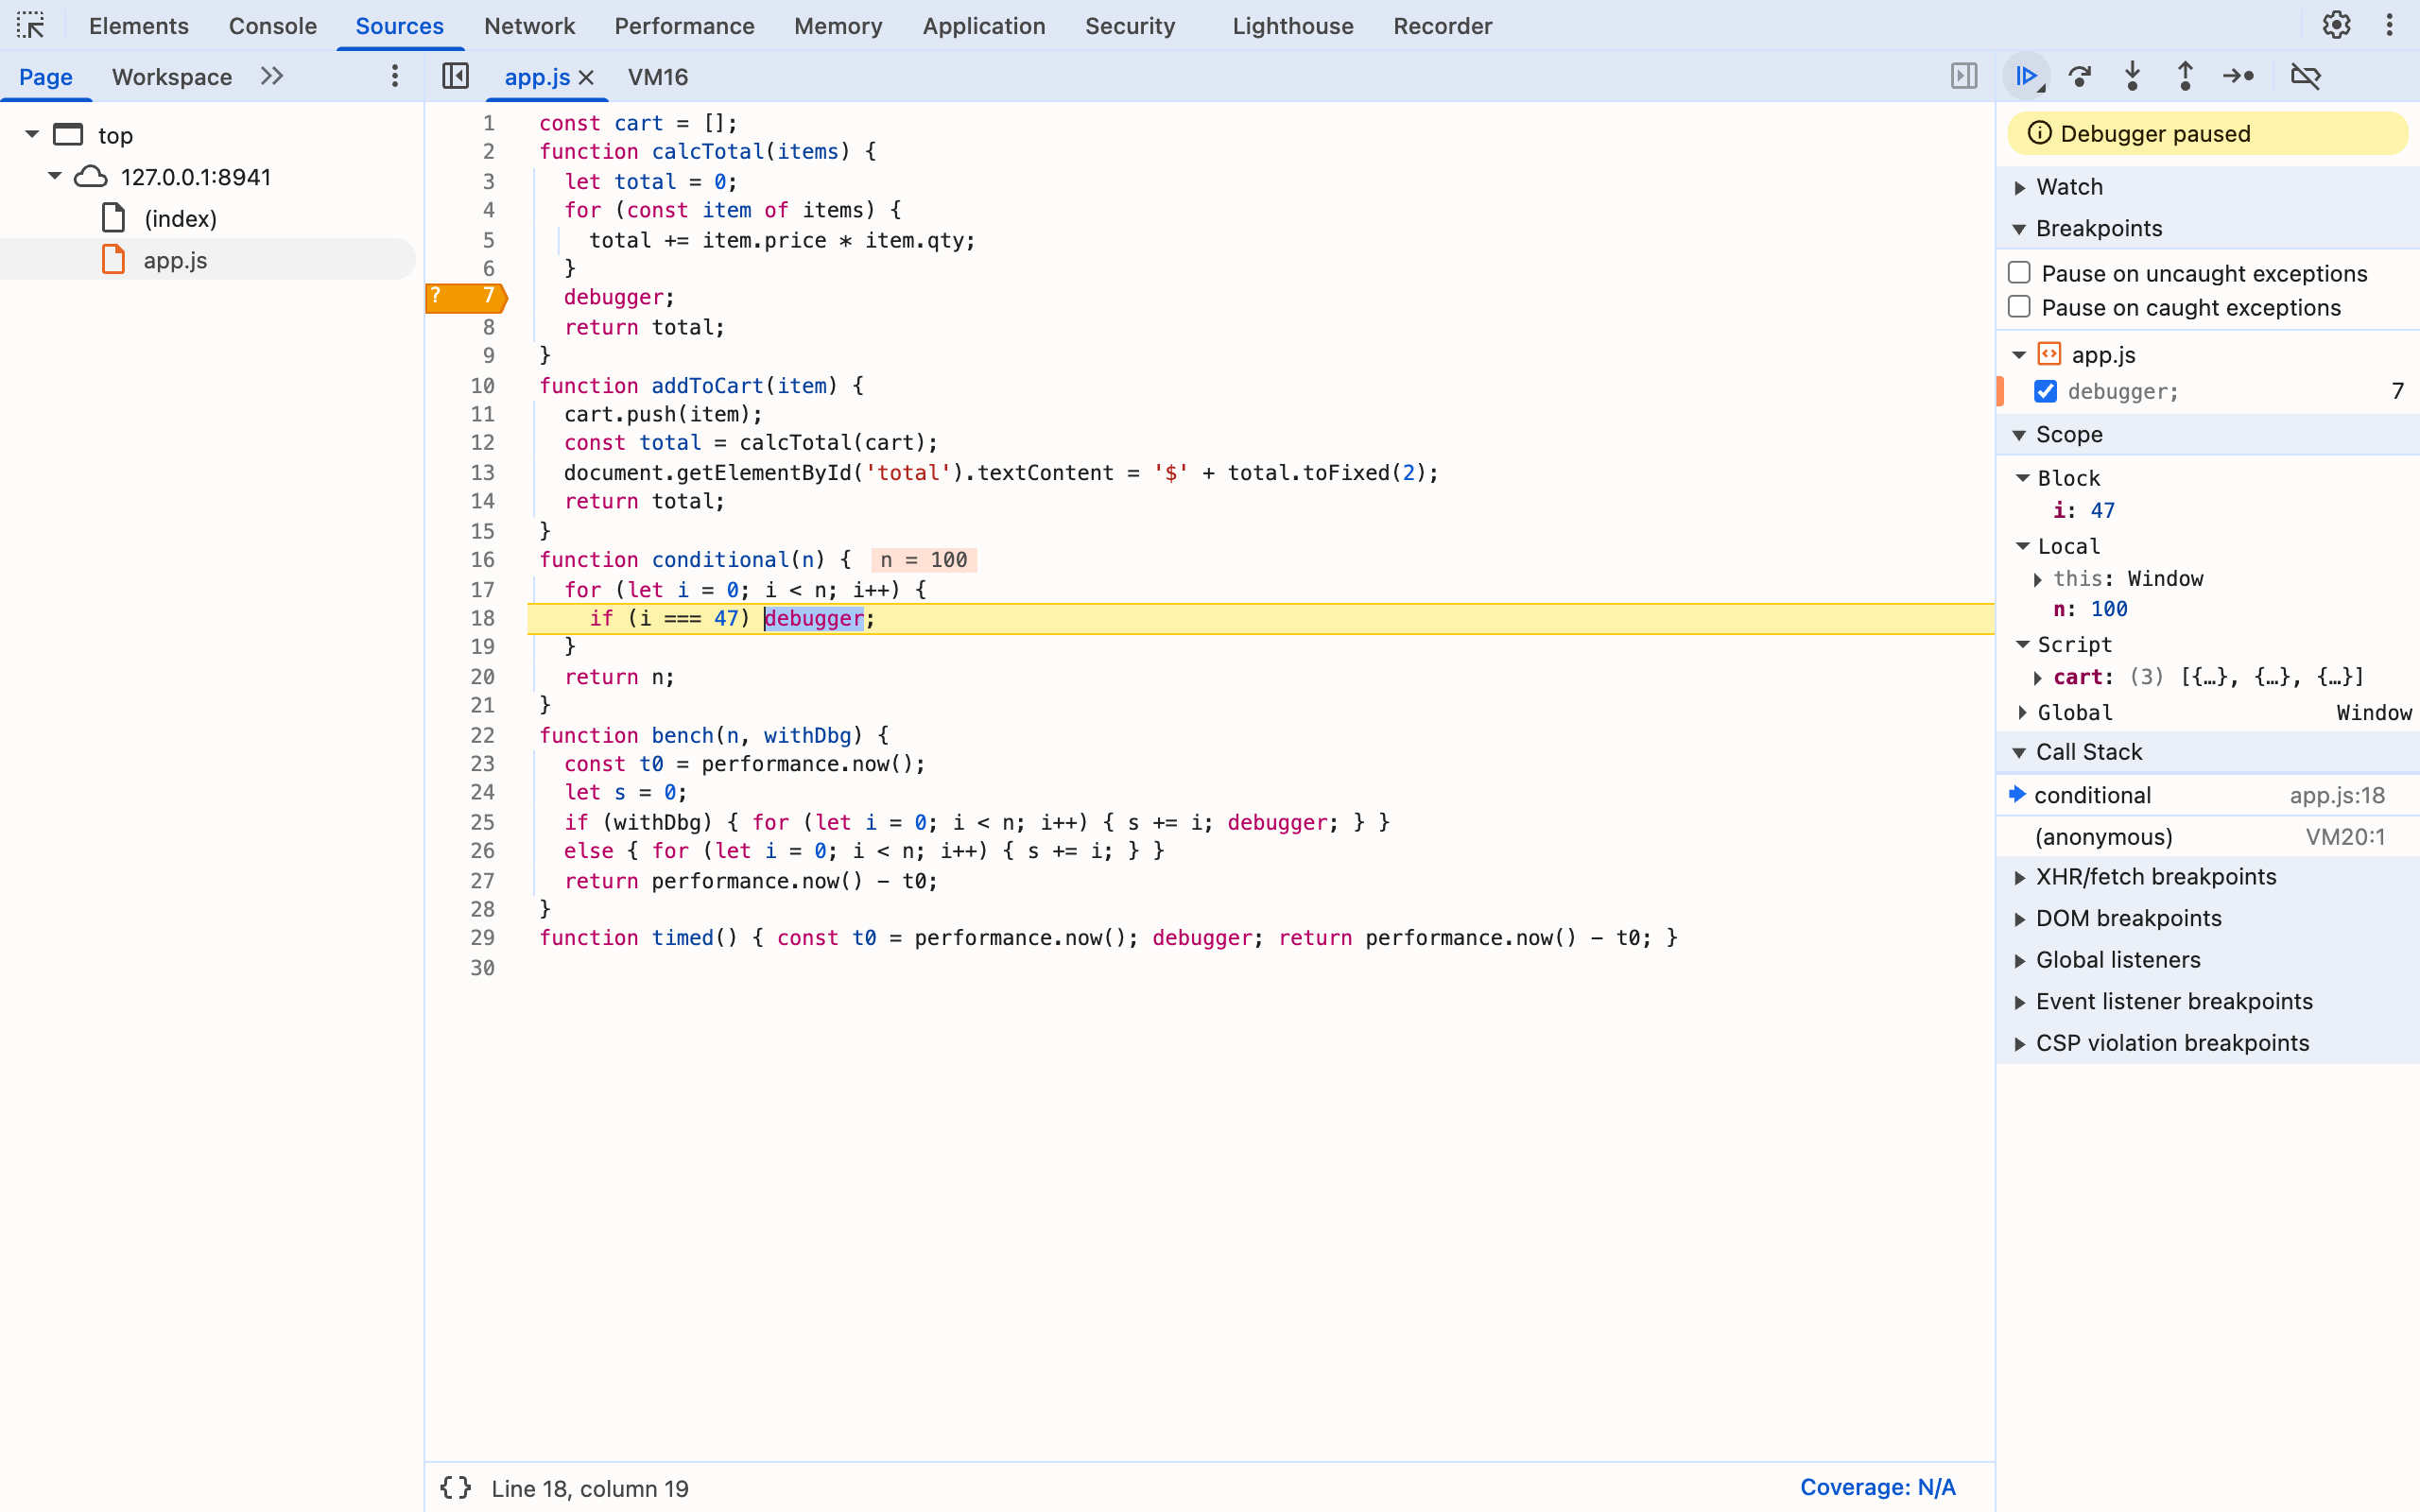
This pattern is the right tool when the condition needs code that DevTools cannot easily express — say, checking an object shape in the middle of a reducer you are already editing. When you are not editing the file anyway, a DevTools conditional breakpoint does the same thing with no code change: right-click a line number, choose Add conditional breakpoint…, and type i === 47. Both approaches are covered alongside logpoints in the Chrome DevTools tips and tricks guide.
Two related tricks from the console: debug(fn) pauses on the first line of a function you know by name, and setTimeout(() => { debugger }, 3000) freezes the page three seconds from now, which is the classic way to inspect a tooltip or popup that disappears when you move the mouse. Both are tested in the Chrome console utilities post.
Silencing a debugger You Cannot Delete: "Never Pause Here"
Sometimes the debugger is not yours — it is in a third-party script, a vendor bundle, or a site that deliberately runs setInterval(() => { debugger }, 100) to make DevTools unusable. I reproduced that anti-debugging loop: with a client auto-resuming each pause, it paused 29 times in 3 seconds. With a human pressing F8, it is effectively a wall.
Chrome has a per-line answer. Right-click the line number of the debugger statement and pick Never pause here:
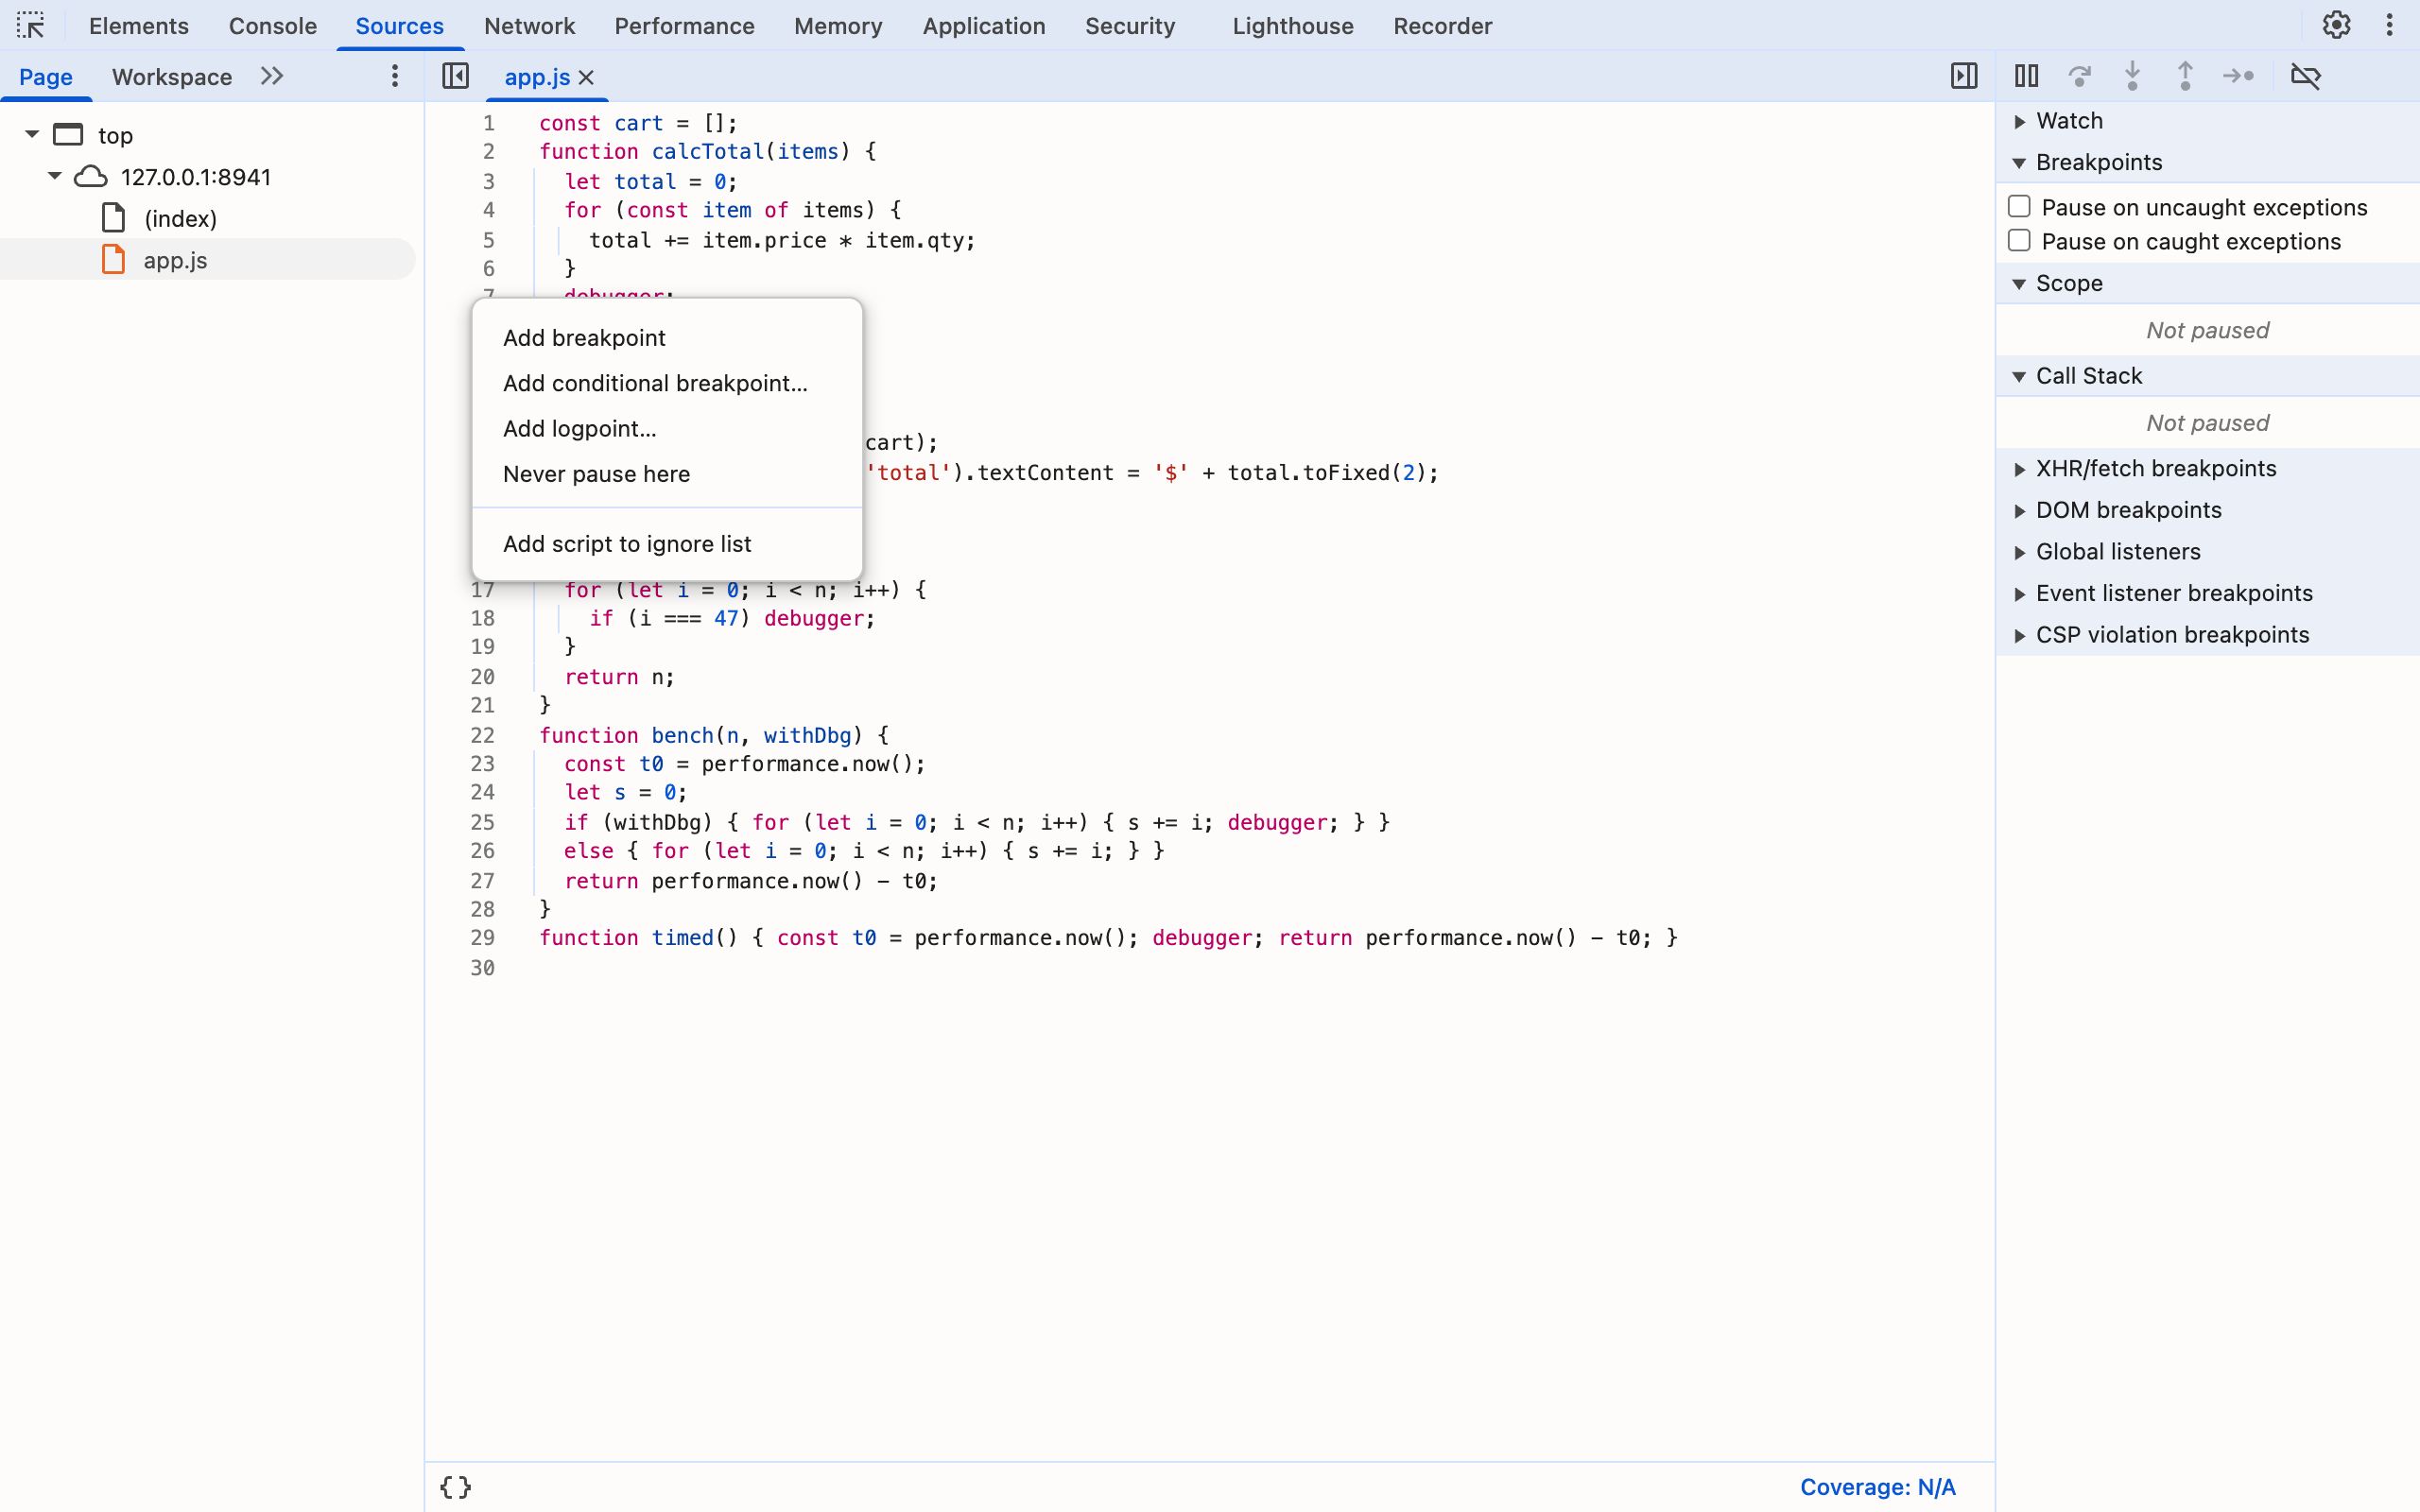
The line gets an orange marker with a question mark, and the breakpoint appears in the Breakpoints pane. After that, clicking "Add to cart" ran through calcTotal without stopping and the page total updated to $119.94:
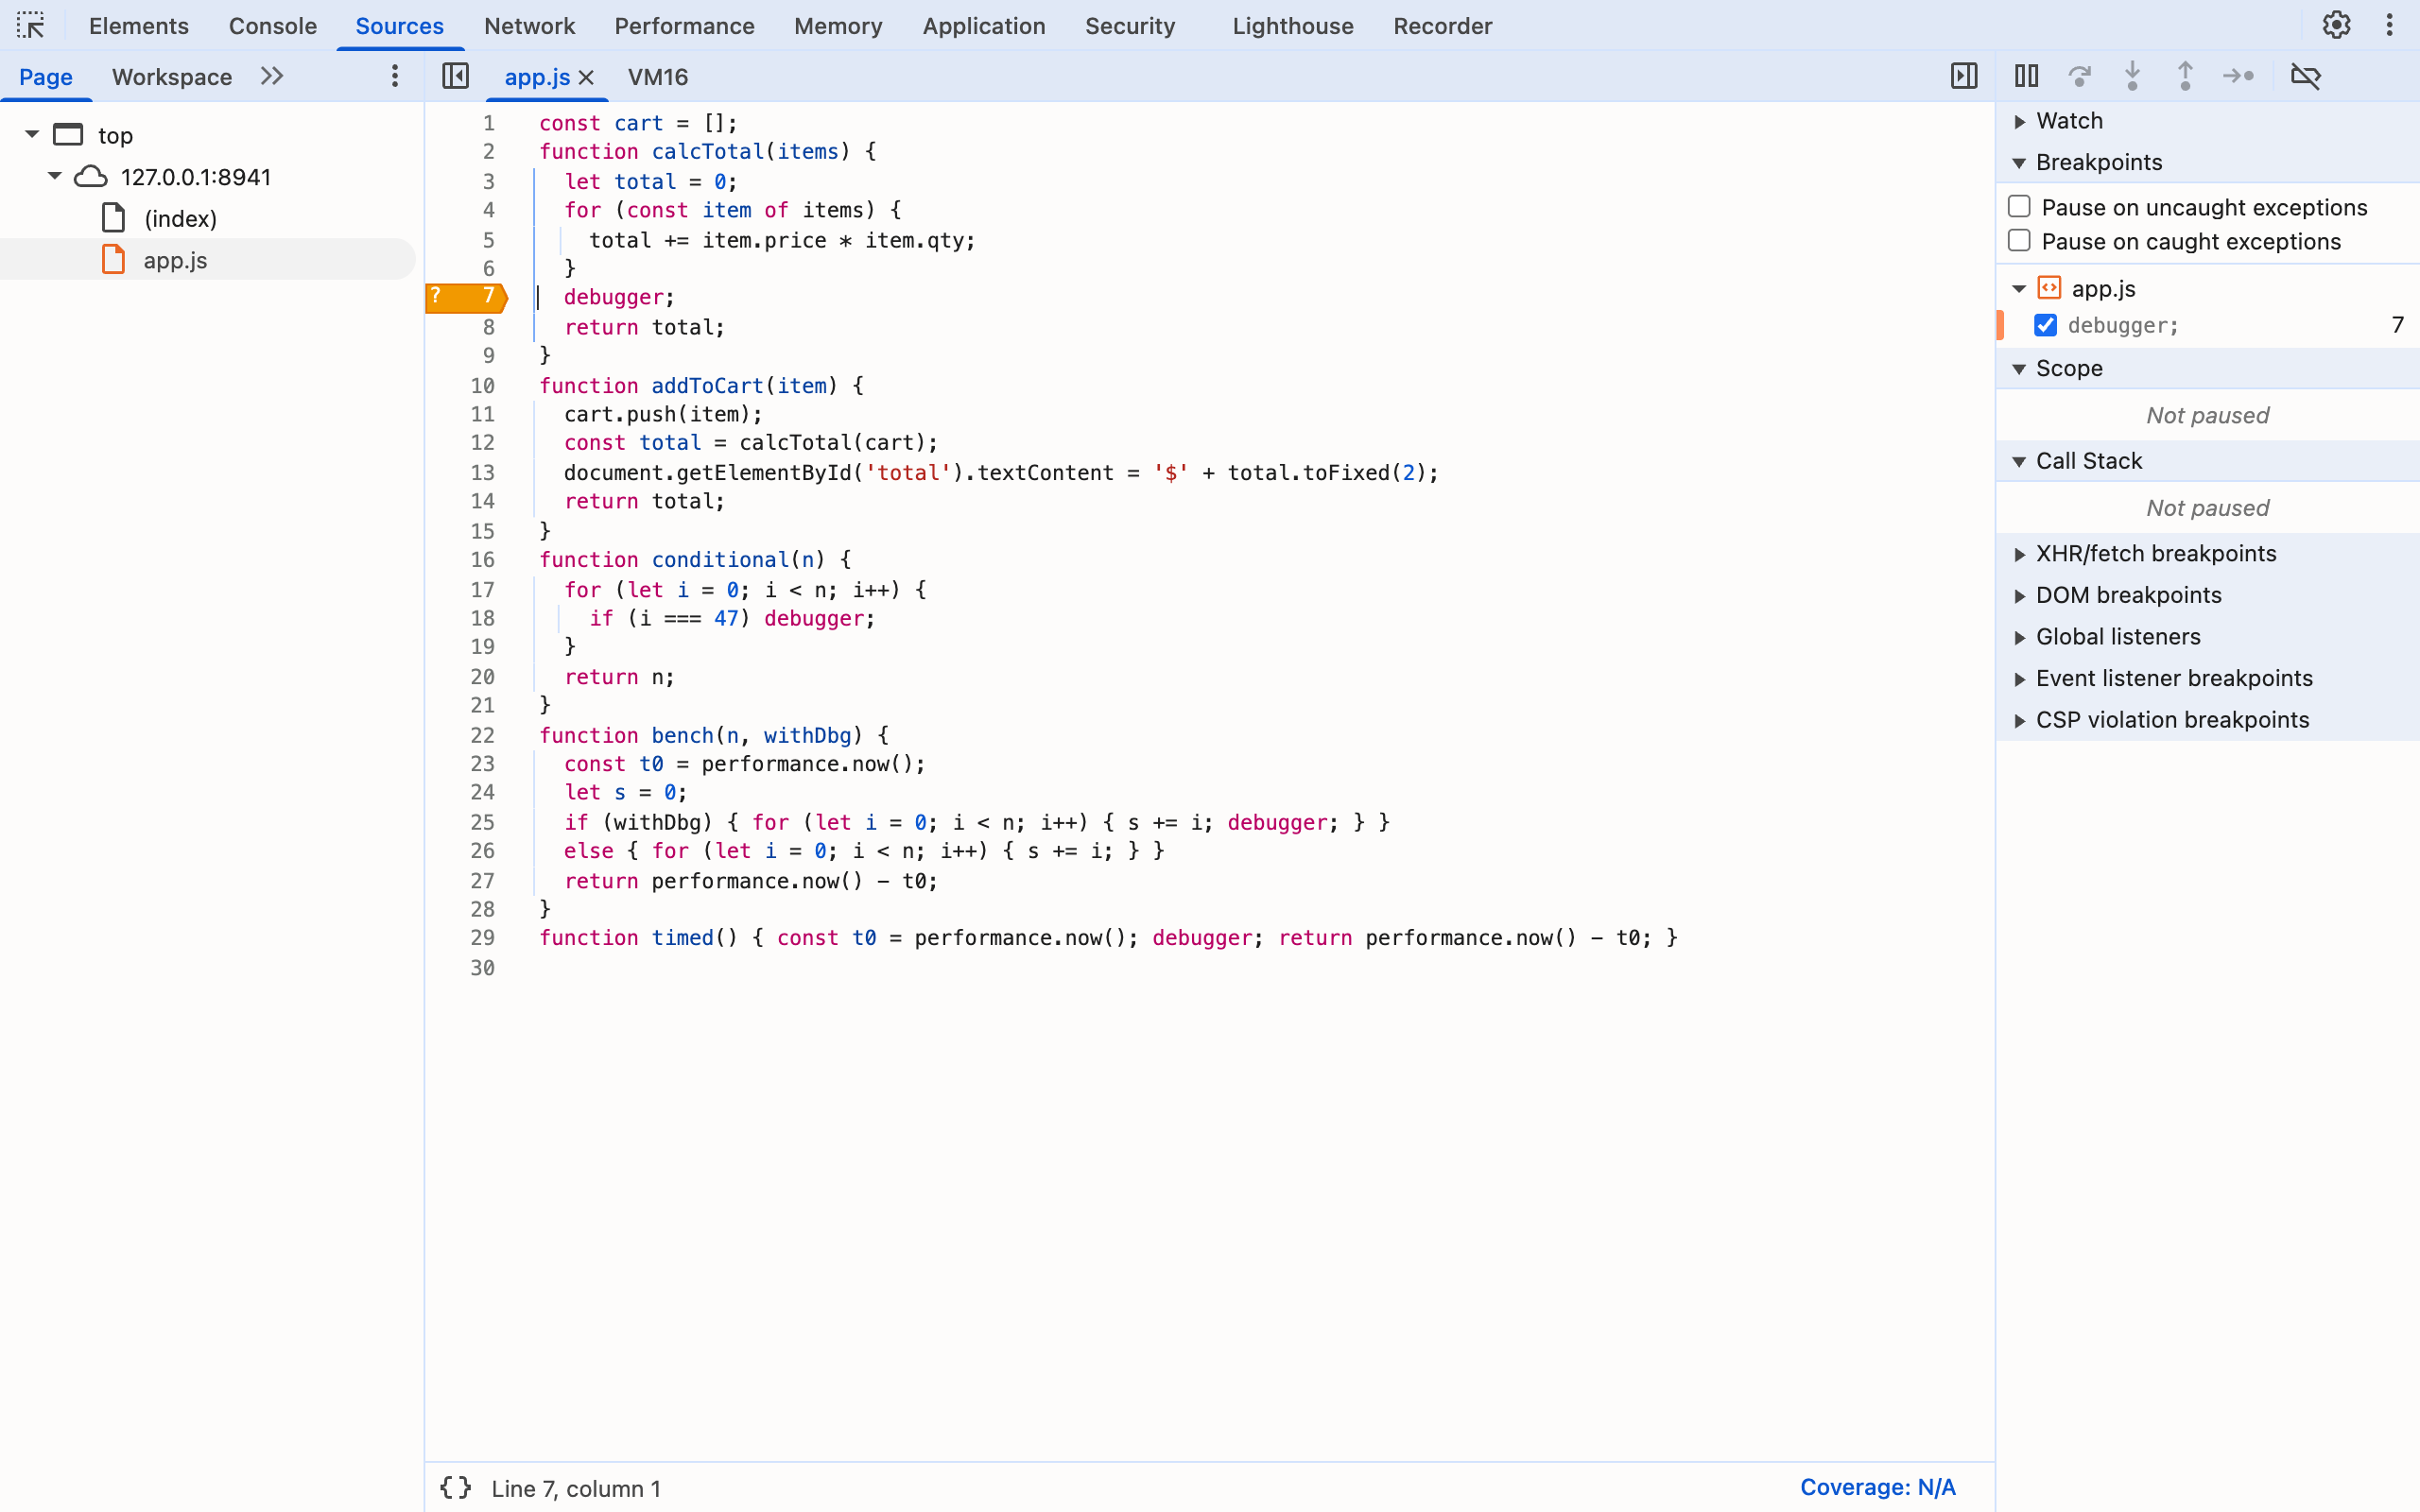
What "Never pause here" actually does is less magical than the name suggests. I read DevTools' saved breakpoint list after clicking it, and the entry was stored as an ordinary conditional breakpoint on that line with "condition": "false". A breakpoint whose condition is false at the same location suppresses the debugger statement there too. I confirmed the same mechanism over the raw protocol: Debugger.setBreakpointByUrl with condition: 'false' on line 7 stopped the pause just like the menu item did.
That means two practical things. It is per line, so other debugger statements still pause — in the conditional-loop screenshot above, line 7 is silenced while line 18 still stopped. And it persists across reloads like any other breakpoint, until you remove it from the Breakpoints pane.
Deactivate Breakpoints: The Global Off Switch
When you want every pause gone at once, click Deactivate breakpoints (the crossed-out tag icon at the end of the debugger toolbar) or press Cmd+F8 / Ctrl+F8. In my test that also covered debugger statements: with breakpoints deactivated, timed() ran straight through and no Debugger.paused event fired.
Here is how the two compare:
| Never pause here | Deactivate breakpoints | |
|---|---|---|
| Scope | One line | Everything: debugger, line, conditional, DOM, XHR breakpoints |
| Survives reload | Yes | Yes, until toggled back |
| Good for | A noisy third-party debugger while you keep debugging your own code | Browsing a site that blocks DevTools, or a quick "let it run" |
| Undo | Remove it in the Breakpoints pane | Press Cmd+F8 / Ctrl+F8 again |
My default for anti-debugging loops is "Never pause here" on the offending line: you keep your own breakpoints working, which you lose with the global switch.
What a debugger Statement Costs
With no debugger attached a debugger statement does nothing visible, but it is not entirely free. I timed a loop of 10 million additions with and without a debugger; inside it, five runs each, with DevTools closed:
| Loop of 10,000,000 iterations | Time (5 runs) |
|---|---|
Without debugger | 9–11 ms |
With debugger in the loop, DevTools closed | 140–145 ms |
1,000,000 iterations with debugger, debugger attached but breakpoints deactivated | 12 ms (vs about 1 ms without) |
That works out to roughly 13 nanoseconds per executed statement — irrelevant in a click handler, but a 14x slowdown in a tight loop. A one-off debugger left in a function that runs a few times per page costs nothing anyone will notice.
The bigger production risk is not speed. Any visitor who happens to have DevTools open — including your own support team reproducing a bug — gets frozen on your code. Two standard guards keep it out of shipped bundles: ESLint's no-debugger rule (part of eslint:recommended), and the minifier. Terser removes debugger statements by default through its drop_debugger option; esbuild only does it when you pass --drop:debugger.
Time, Timers and the Paused Page
One last behavior that matters when you debug anything timing-related. I paused inside a function that reads performance.now() before and after its debugger line, waited two seconds, and resumed. The function reported 2,004 ms. The wall clock keeps running while you are paused, so any duration you measure across a pause is inflated by however long you sat there.
The page itself does not keep running. A setInterval ticking every 100 ms had fired zero times during the 2-second pause; timers, rendering and event handlers all wait until you resume. That is exactly why the delayed-debugger trick works for disappearing popups — the frozen page cannot run the code that would hide them.
Frequently Asked Questions
What does the debugger statement do in JavaScript? It works like a breakpoint written into your code. When Chrome DevTools is open, execution pauses on that line in the Sources panel with the full call stack and local variables. When DevTools is closed, the statement does nothing.
Why does my debugger statement not pause in Chrome?
The three usual causes: DevTools is not open in that tab, breakpoints are deactivated (Ctrl+F8 or Cmd+F8 toggles it), or the line has a Never pause here marker. Also check that your bundler did not strip the statement, which Terser does by default in production builds.
How do I stop a site from pausing on debugger all the time?
Right-click the line number of the debugger statement in Sources and choose Never pause here, which adds a breakpoint with the condition false. Or deactivate all breakpoints with Ctrl+F8 (Cmd+F8 on Mac). Both stopped a setInterval debugger loop in my Chrome 156 test.
Is it bad to leave debugger statements in production code?
For normal users it does nothing visible, but any visitor with DevTools open gets paused on your code, and a debugger inside a hot loop is measurably slower. Remove it with the ESLint no-debugger rule or let your minifier drop it.
What is the difference between debugger and a breakpoint? A debugger statement lives in the source file, so it travels with the code and works in any environment with a debugger attached. A DevTools breakpoint lives only in your DevTools settings, needs no code change and can carry a condition, but nobody else gets it.
Does time keep running while paused on debugger?
The clock does, the page does not. In my test performance.now() advanced by about 2,000 ms across a 2-second pause, while a 100 ms setInterval did not fire a single time until I resumed.
When you have tracked the bug down to a line, the next step is usually pasting the page into an issue or a chat. Ctrl+Shift+C copies the current tab's URL with one shortcut — no address bar trip, no right-click, and no data collected.
Try Ctrl+Shift+C
Copy any URL with one keyboard shortcut. Free forever, no data collected.