DevTools Network Throttling Guide: Presets Measured
DevTools network throttling slows the inspected tab's network to a preset speed: in Chrome 154 the presets are Fast 4G (about 8.1 Mbps, 165 ms latency), Slow 4G (1.44 Mbps, 562.5 ms), 3G (400 kbps, 2,000 ms) and Offline. Pick one from the dropdown in the Network panel toolbar, tick Disable cache, and reload.
Most throttling guides stop at the menu. This DevTools network throttling guide goes further: I pulled the exact numbers each preset uses out of Chrome 154.0.8037.93's DevTools source, then loaded the same 628 KB test page under every preset, three times each, to see what those numbers do to a real page load. I also found the one checkbox that makes throttling nearly meaningless if you forget it.
Where the Throttling Controls Live
The main control is the dropdown in the Network panel toolbar, which reads "No throttling" by default. In Chrome 154 it contains exactly these entries, grouped into three sections:
- Disabled: No throttling
- Presets: Fast 4G, Slow 4G, 3G, Offline
- Custom: Add…
When any throttling is active, the Network tab label shows a warning triangle, as in the screenshots below. It is easy to forget a preset is on, so treat that icon as a reminder to switch it off. In my testing the chosen preset was still selected when I closed and reopened DevTools.
There is also a separate "Network conditions" drawer, which you can open from the DevTools command menu by typing "network conditions".
The Real Numbers Behind Each Preset
The labels are deliberately vague, so here are the values Chrome 154's DevTools actually sends to the browser. I read them from the DevTools front end bundled with Chrome 154, where each preset is defined as a nominal speed multiplied by a correction factor:
| Preset | Download | Upload | Latency added | Defined in source as |
|---|---|---|---|---|
| Fast 4G | 1,012,500 B/s (≈ 8.1 Mbps) | 168,750 B/s (≈ 1.35 Mbps) | 165 ms | 9 Mbps × 0.9, 1.5 Mbps × 0.9, 60 ms × 2.75 |
| Slow 4G | 180,000 B/s (≈ 1.44 Mbps) | 84,375 B/s (≈ 675 kbps) | 562.5 ms | 1.6 Mbps × 0.9, 750 kbps × 0.9, 150 ms × 3.75 |
| 3G | 50,000 B/s (400 kbps) | 50,000 B/s (400 kbps) | 2,000 ms | 500 kbps × 0.8, 400 ms × 5 |
| Offline | 0 | 0 | — | All requests fail |
Two things stand out. First, the latency is applied per request: Chrome guarantees at least that delay between sending a request and receiving its response headers. That is why the latency multipliers are large — a 400 ms round trip becomes 2,000 ms of added delay to approximate the multiple round trips of a real connection setup.
Second, the names changed. If you remember "Slow 3G" and "Fast 3G", they are still here under new labels: the old Fast 3G values are now Slow 4G, and the old Slow 3G values are now plain 3G. The DevTools source still exports the 3G preset under the name Slow3GConditions. Each preset also carries a target round-trip time (400, 150 and 60 ms), which DevTools uses to suggest the closest preset to a measured real-user RTT.
Measured: One Page, Every Preset
Numbers in a table are abstract, so I measured them. The test page was 7 requests totaling 627,824 bytes: an HTML file, a 62 KB stylesheet, a 157 KB script and four 102 KB images, served from a local server so the real network added nothing. For each preset I disabled the cache, loaded the page three times, and took the median.
| Preset | First Contentful Paint | Load event | Slowdown vs. unthrottled |
|---|---|---|---|
| No throttling | 36 ms | 20 ms | — |
| Fast 4G | 732 ms | 975 ms | ≈ 49× |
| Slow 4G | 3,228 ms | 4,671 ms | ≈ 234× |
| 3G | 11,472 ms | 16,738 ms | ≈ 837× |
The runs were remarkably stable — the three 3G loads finished at 17,195, 16,723 and 16,738 ms — and the wall-clock time from navigation to the load event matched the browser's own timing to within 30 ms.
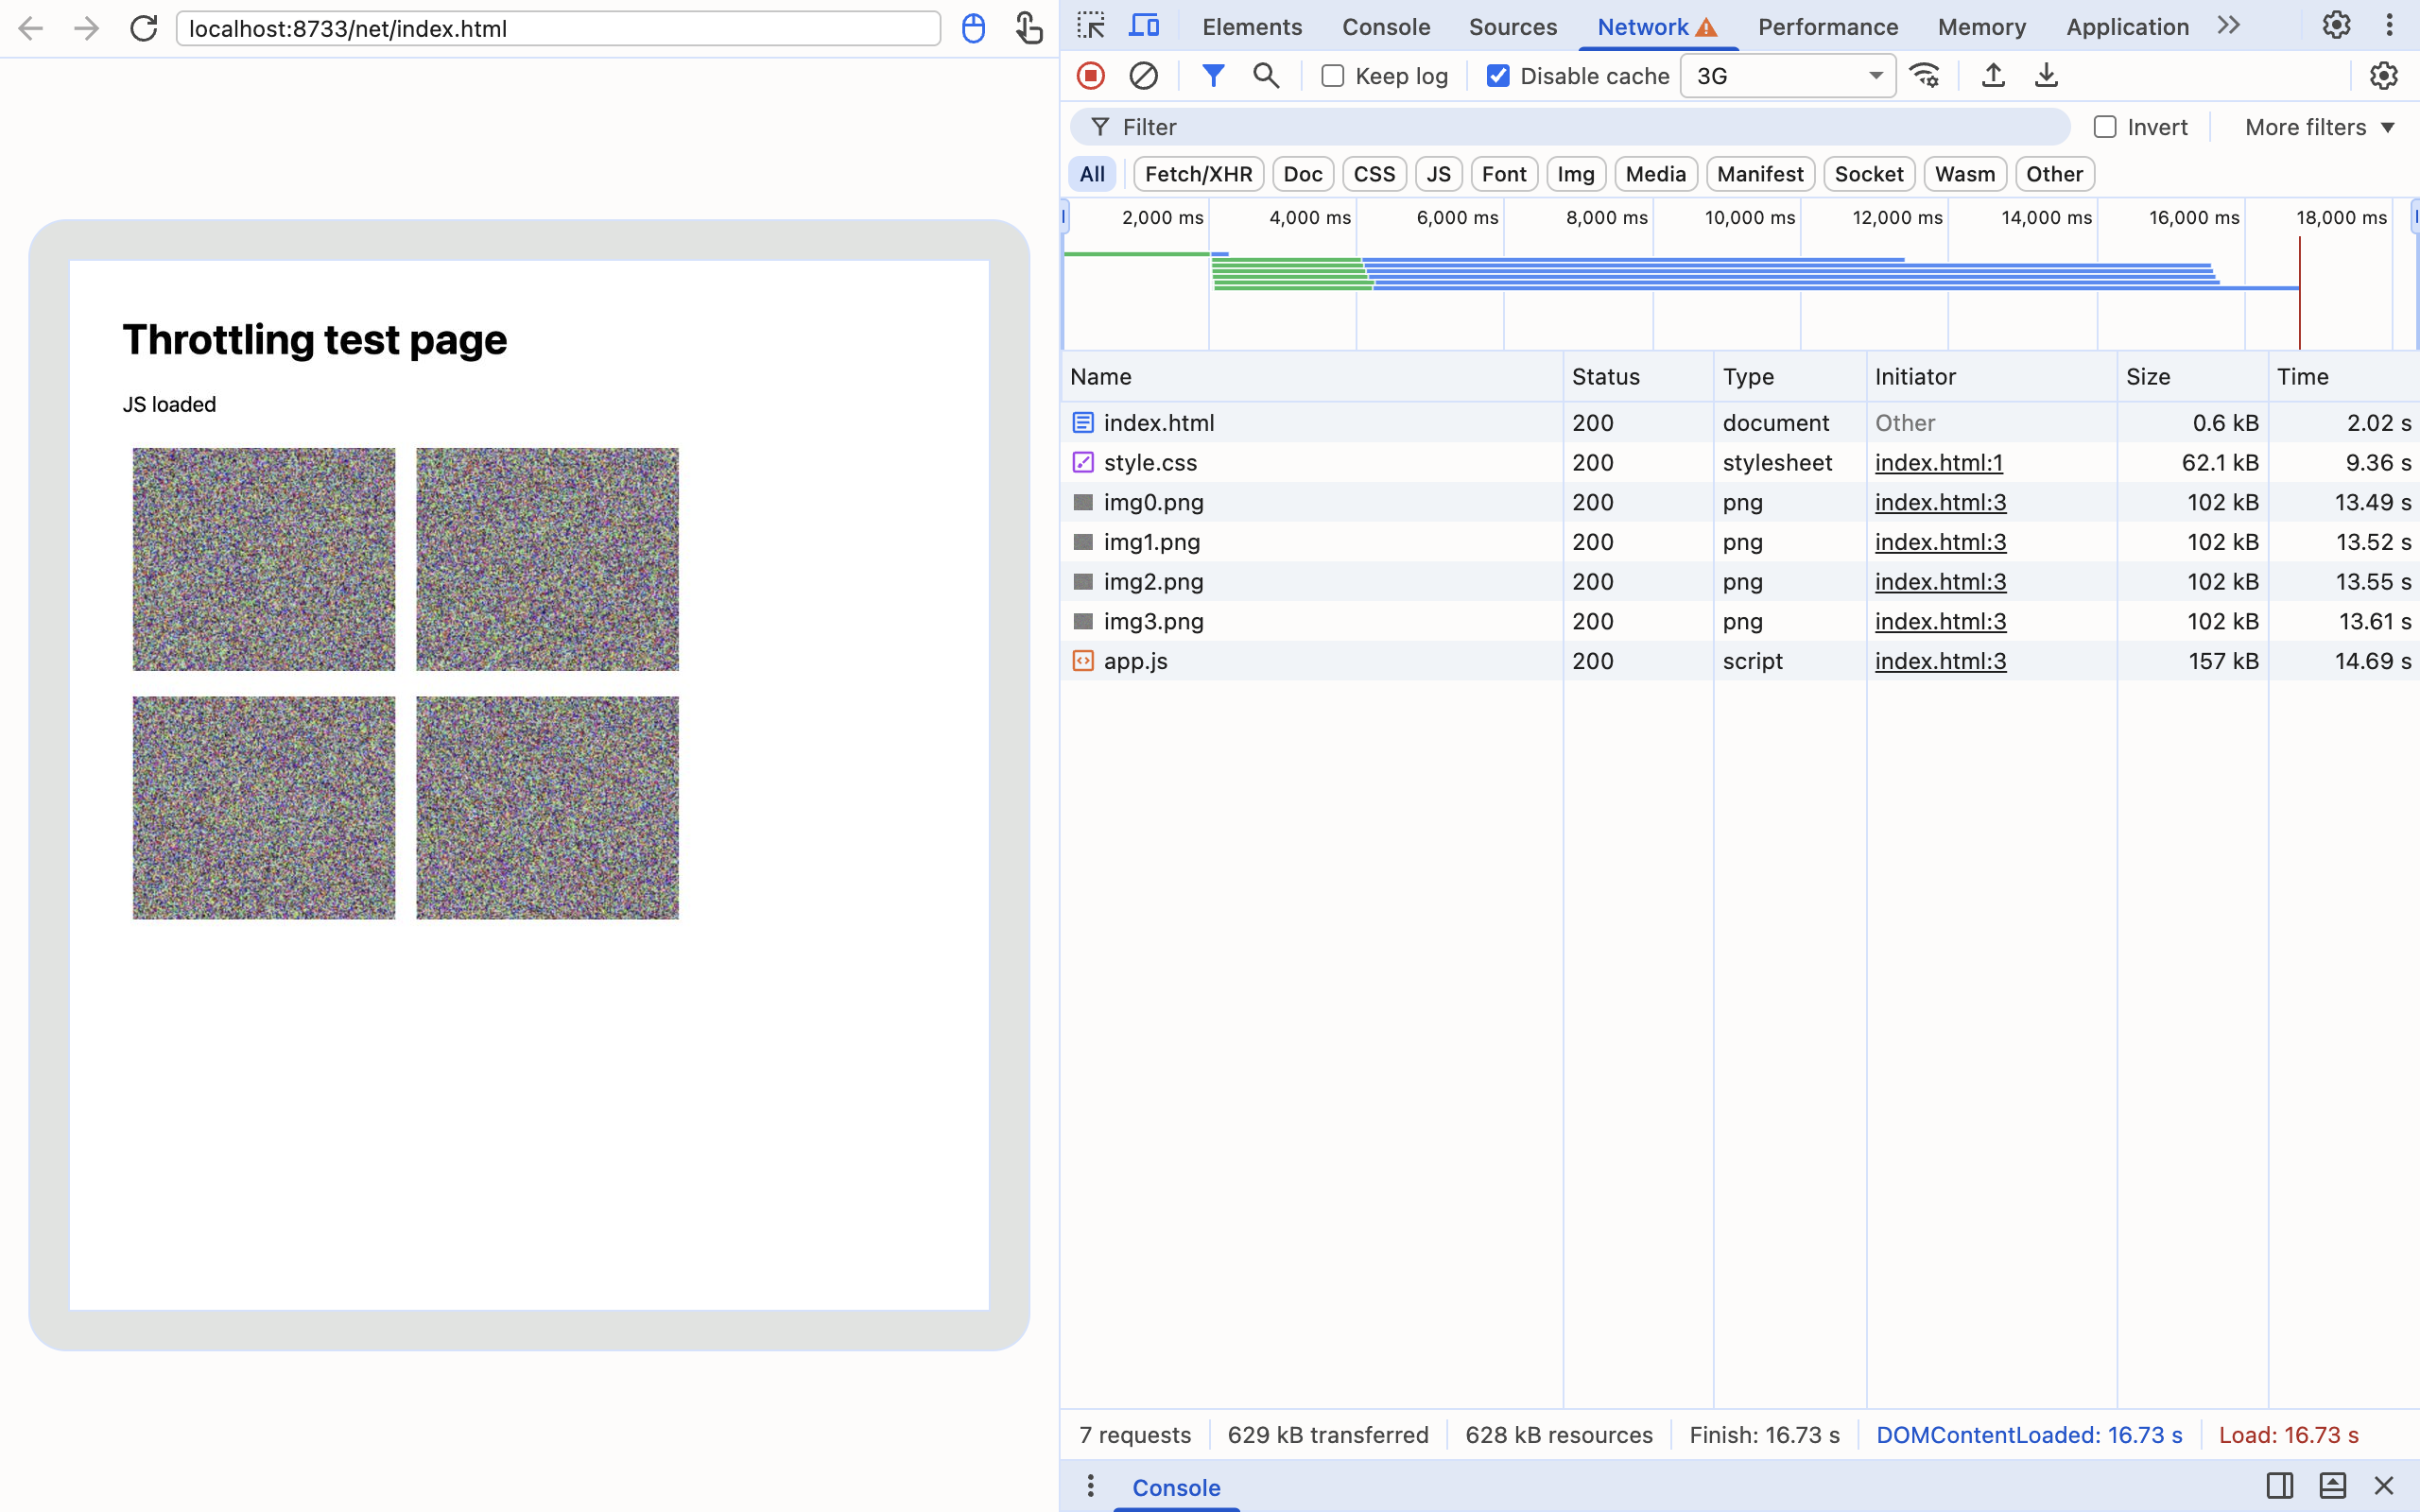
The more useful finding is how predictable the results are. Total load time landed within 3% of a simple formula: total bytes ÷ download speed, plus the preset latency once per round of requests. My page had two rounds (the HTML, then everything it references), so on 3G that is 627,824 ÷ 50,000 = 12.56 seconds of transfer plus 2 × 2 seconds of latency = 16.56 seconds, against 16.74 measured. Fast 4G predicted 0.95 seconds and measured 0.975.
Notice also in the waterfall that all four images finish at nearly the same moment, around 13.5 seconds. The throughput limit is shared by every request in the tab, not given to each one separately, so parallel downloads split the bandwidth instead of multiplying it. That matches what real slow connections do.
The Disable Cache Trap
On my first 3G run through the DevTools UI, the page loaded in 2.06 seconds. Not 16.
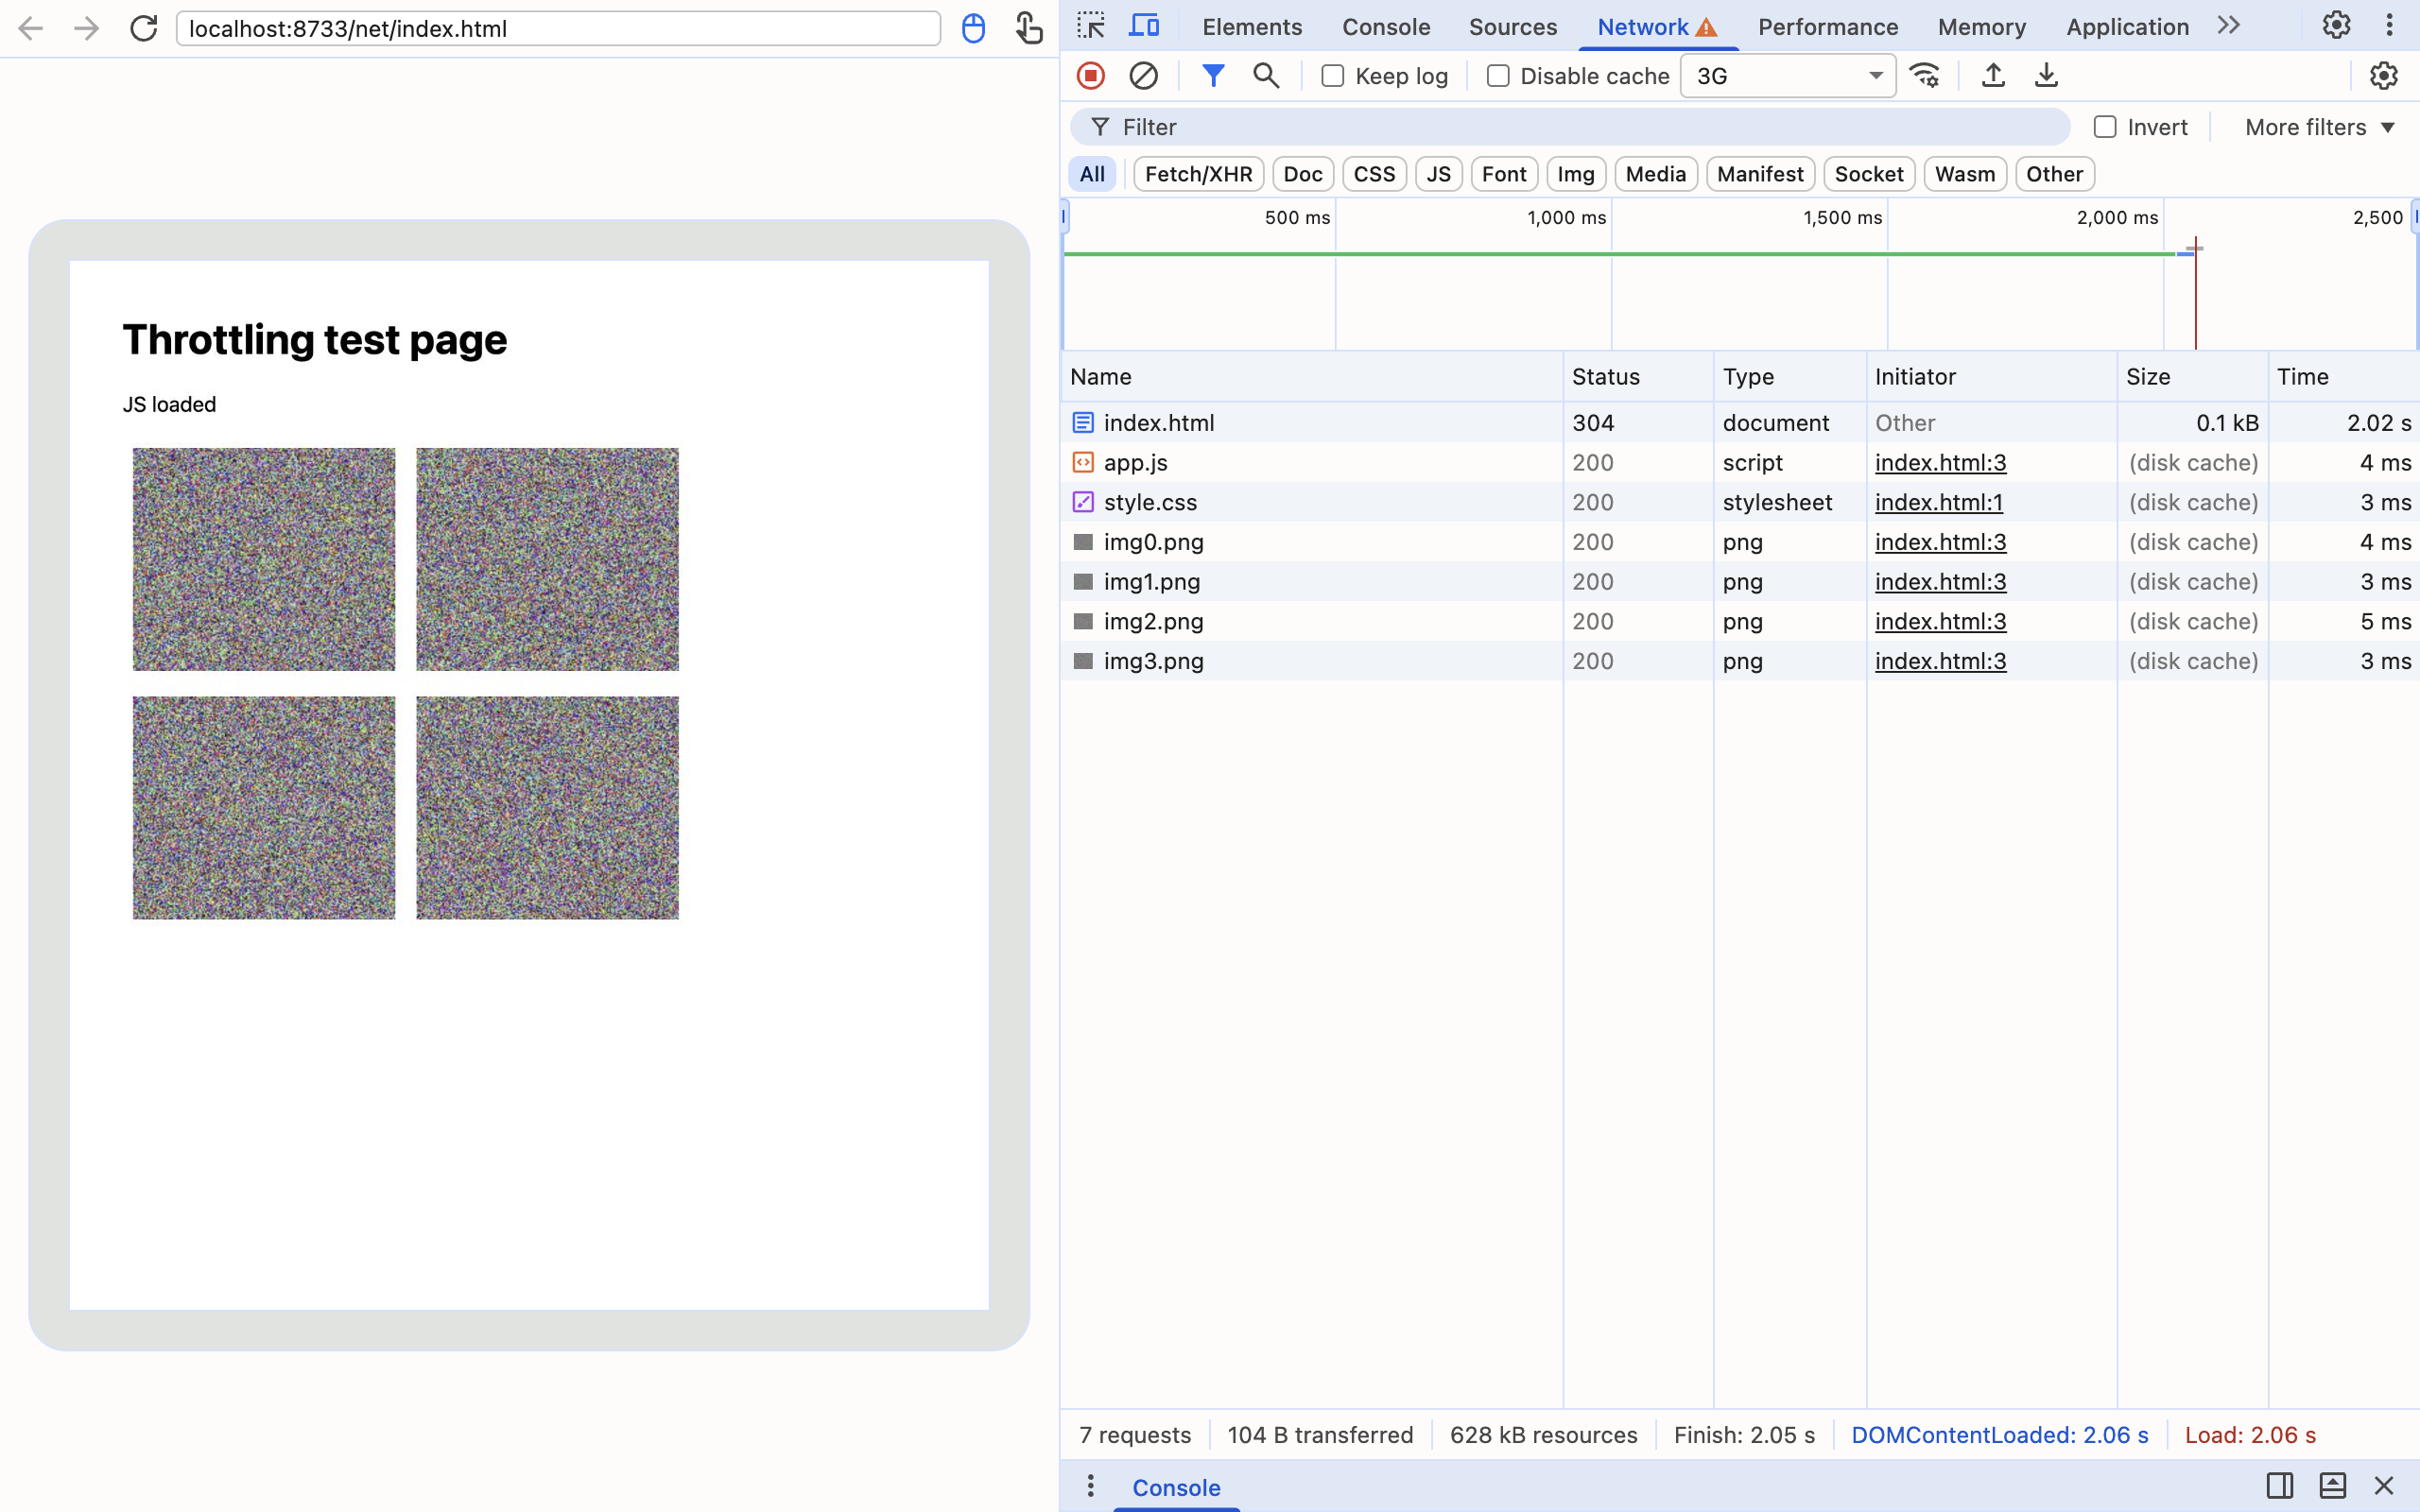
The Size column shows why: every subresource came from (disk cache), and only the HTML went to the network, as a 304 Not Modified that took 2.02 seconds — almost exactly one 3G latency. Throttling was working perfectly; it simply had nothing to throttle. The real first-visit experience, with Disable cache ticked, was eight times slower.
So the rule for any DevTools network throttling test: tick Disable cache in the Network toolbar first. It only applies while DevTools is open, so it will not affect your normal browsing. If you only want one cache-free reload rather than a persistent setting, a hard reload does the same job — see the Chrome hard reload shortcut for the variants.
Throttle a Single Request or Domain
Global throttling answers "how does my page feel on a slow network". A more common debugging question is "what happens when one thing is slow" — a third-party script, an API endpoint, a font server. Chrome 154 can throttle individual requests.
Right-click any request in the Network panel and open Throttle requests. It offers Throttle request URL and Throttle request domain:
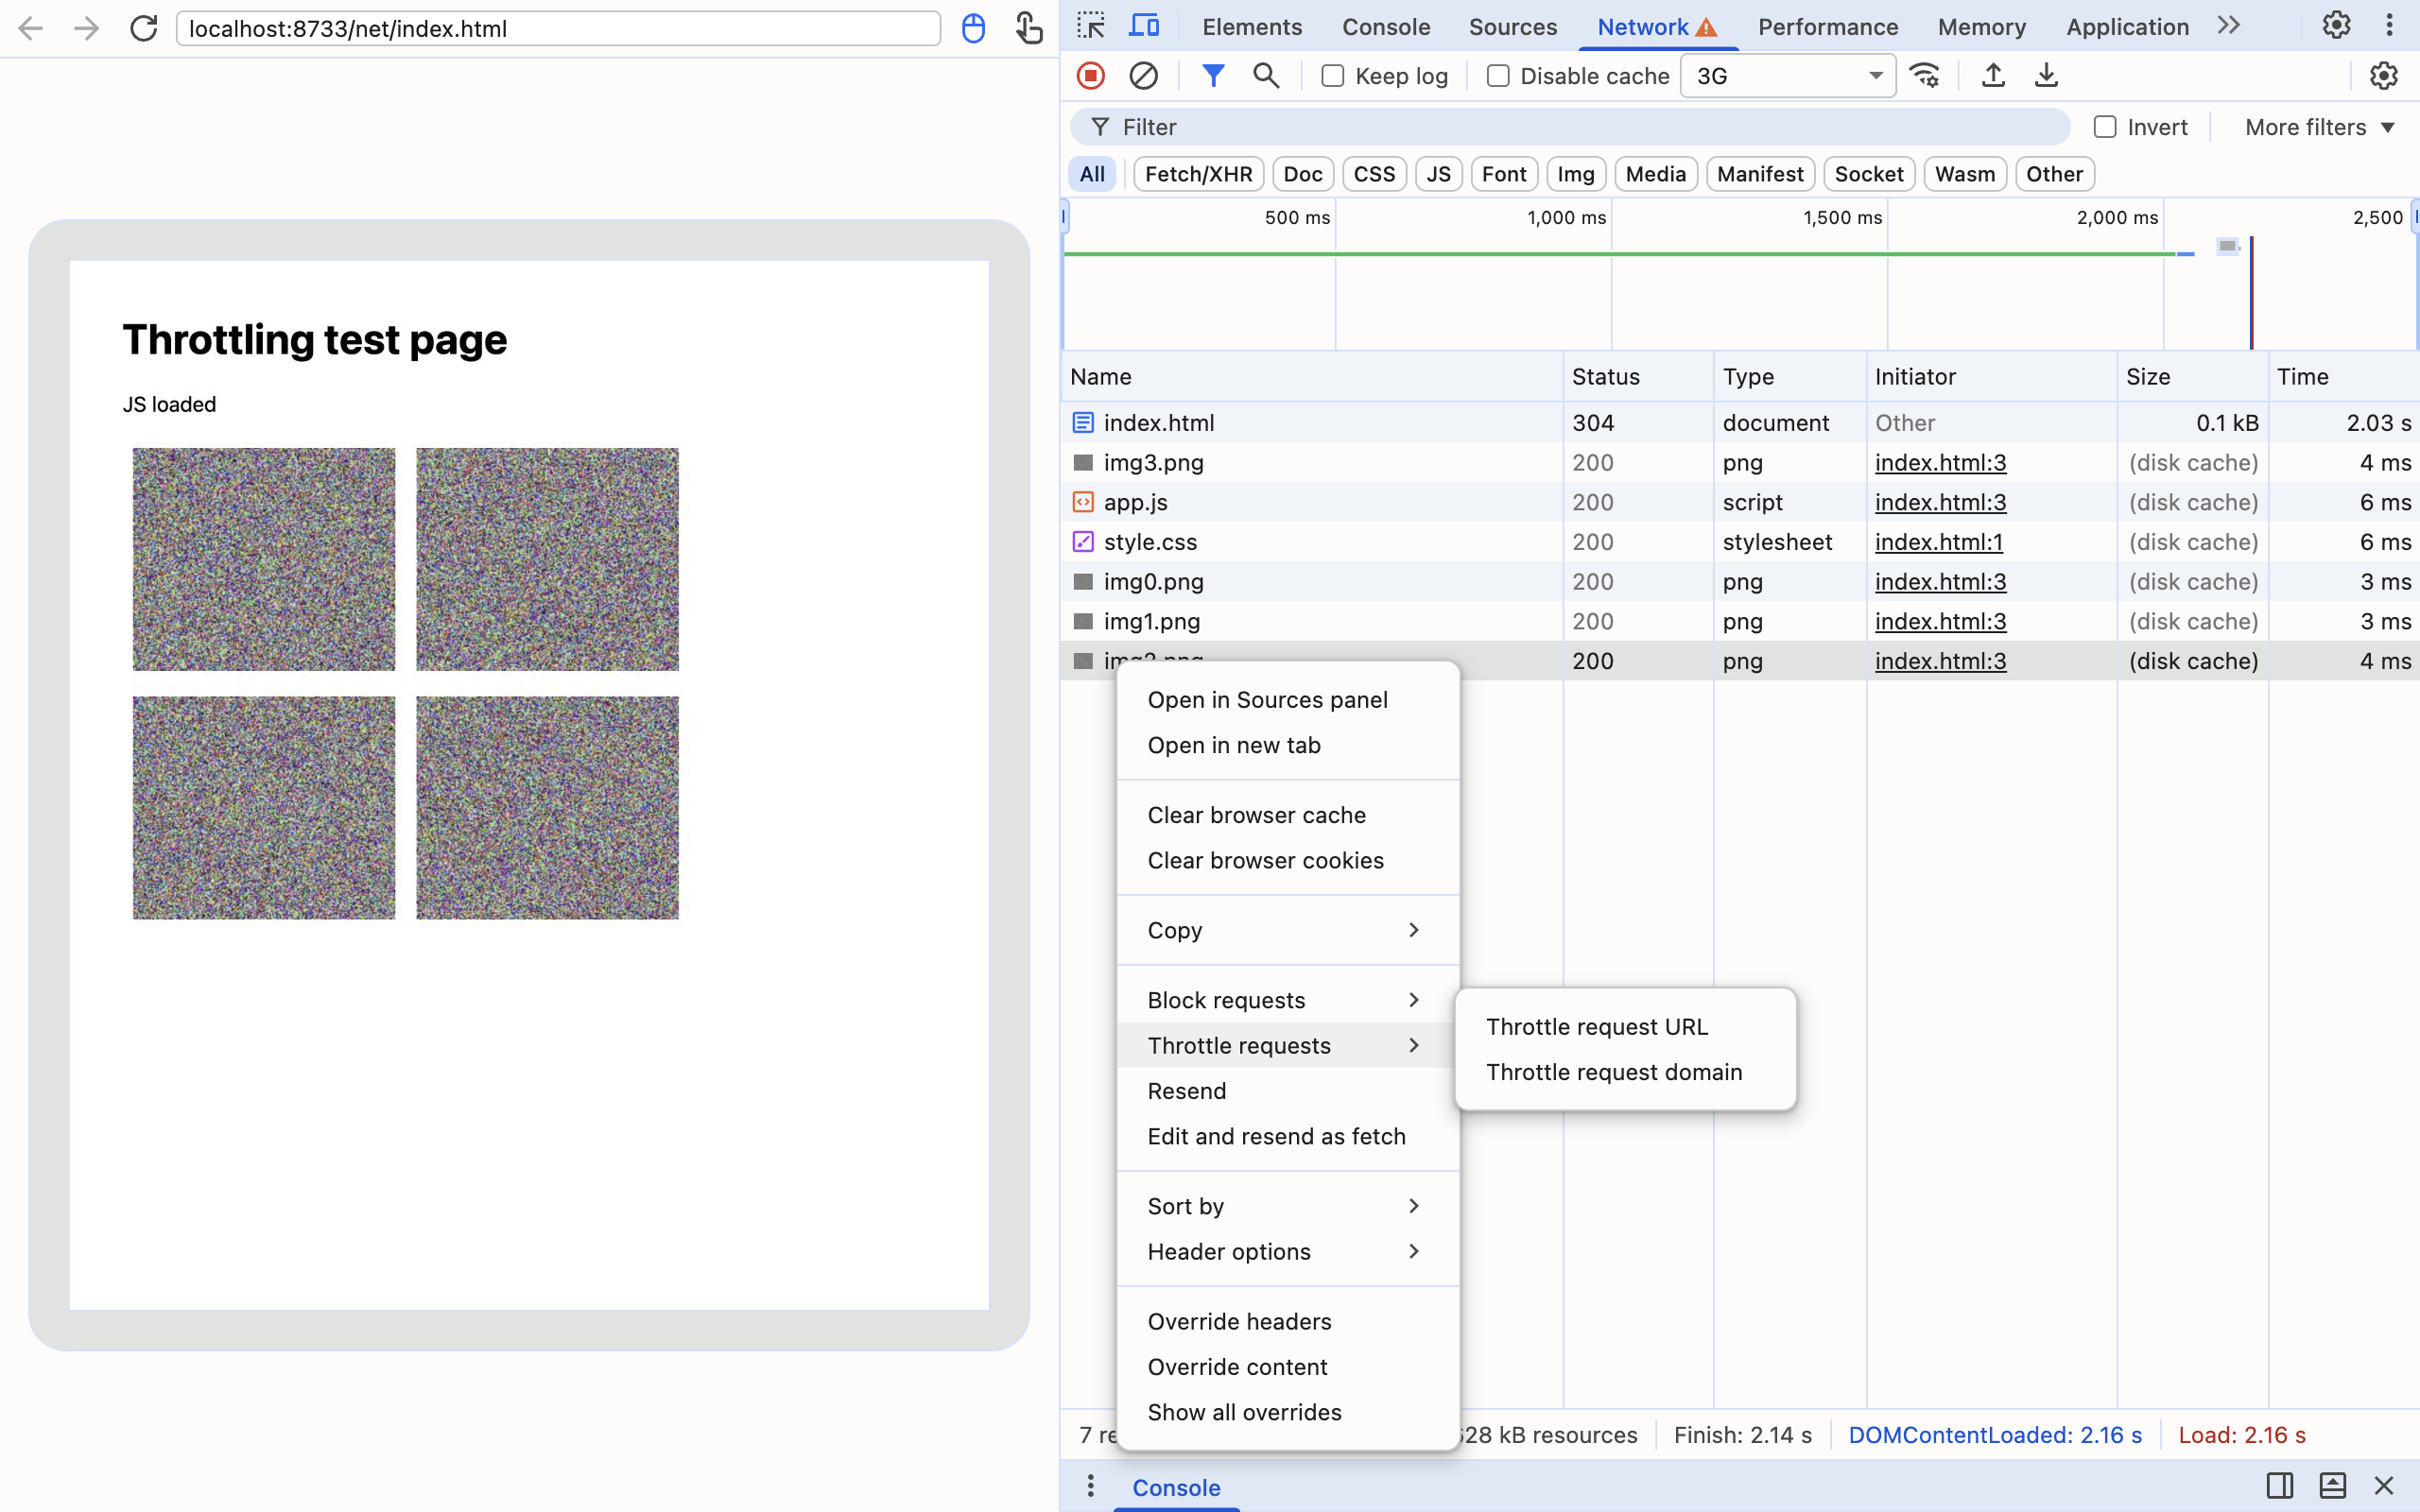
The rules land in the Request conditions drawer — the successor to the old request blocking drawer, now handling both blocking and throttling with URL Pattern syntax. The command menu entry is "Show request conditions".
I measured the effect with the 3G profile applied to my 157 KB script alone. The page painted its first content at 104 ms, essentially unthrottled, while the load event moved to 5,192 ms — again matching the formula: 156,433 bytes ÷ 50,000 B/s plus 2 seconds of latency. That is exactly the test you want for questions like "does my page render without waiting for this script", and global throttling cannot answer it.
Custom Profiles, CPU Throttling and Offline
Custom profiles. Choose "Add…" in the dropdown (or run "Show Throttling" from the command menu) to define your own profile in the Throttling settings. The presets model mobile networks; if your analytics say your users are mostly on decent Wi-Fi with high latency, a custom profile describing that is a more honest test than any preset.
CPU throttling is separate. Network throttling does nothing to JavaScript execution speed. A slow phone is slow at both, so for realistic mobile tests set CPU throttling in the Performance panel as well — the Chrome DevTools tips and tricks guide covers the Performance panel side.
Offline. The Offline preset fails every request. When I emulated offline over the DevTools Protocol, a navigation failed with net::ERR_INTERNET_DISCONNECTED — the state you need for testing offline pages and service worker fallbacks.
Throttling From Puppeteer and Scripts
Automated tests can apply the same conditions over the DevTools Protocol, and there is a change worth knowing about. In Chrome 154's protocol, the long-standing Network.emulateNetworkConditions command is marked deprecated, in favor of Network.emulateNetworkConditionsByRule (plus Network.overrideNetworkState for the navigator side). The new command takes a list of rules with optional URL patterns, which is what powers the per-request throttling above; an empty pattern applies to everything.
I ran my measurements with both commands. They produced the same results — 975 ms on Fast 4G and 4,672 ms on Slow 4G with the old command, against 975 ms and 4,671 ms with the new one — so migrating does not change your baselines. To reproduce a DevTools preset in a script, use the byte-per-second and latency values from the table above, not the Mbps labels.
A Throttling Checklist
- Tick Disable cache before anything else.
- Pick the preset that matches your users, or add a custom profile.
- Reload and read Finish, DOMContentLoaded and Load in the Network status bar.
- Use Throttle request URL to test one slow dependency in isolation.
- Add CPU throttling in the Performance panel for mobile realism.
- Switch throttling off when done — watch for the warning triangle on the Network tab.
QA folks who test slow-network behavior regularly may also find the extension-side tools in Chrome extensions for QA testers useful alongside DevTools.
Frequently Asked Questions
What speeds do the DevTools throttling presets use? In Chrome 154, Fast 4G is about 8.1 Mbps down, 1.35 Mbps up with 165 ms latency. Slow 4G is 1.44 Mbps down, 675 kbps up with 562.5 ms latency. 3G is 400 kbps both ways with 2,000 ms latency. Offline blocks all requests.
Where did Slow 3G and Fast 3G go? The presets were relabeled. The values once called Fast 3G now appear as Slow 4G, and the values once called Slow 3G now appear as 3G. A Fast 4G preset sits above them. The internal names in the DevTools source still reflect the old labels.
Why does throttling barely slow down my page? Usually because the browser cache is serving most files. With the cache enabled, my 628 KB test page loaded in 2.06 seconds on the 3G preset, because only the HTML was revalidated. With Disable cache ticked it took 16.73 seconds. Always tick Disable cache when measuring.
Can I throttle only one request or one domain in DevTools? Yes, in Chrome 154. Right-click a request in the Network panel and choose Throttle requests, then Throttle request URL or Throttle request domain. The rules appear in the Request conditions drawer, and the rest of the page loads at full speed.
Does DevTools network throttling also slow the CPU? No. Network throttling only delays and limits network traffic. CPU throttling is a separate setting in the Performance panel. To simulate a slow phone on a slow network, set both.
Does network throttling affect other tabs? No. It applies only to the tab being inspected. In my test, with one tab throttled to 3G, a second tab loaded the same page in 188 ms while the throttled tab took 17 seconds.
Testing on a throttled connection usually ends with a bug report, and a bug report starts with the URL of the page that misbehaved. Ctrl+Shift+C copies it in one keystroke from any tab — no permissions beyond the clipboard and no data collected.
Try Ctrl+Shift+C
Copy any URL with one keyboard shortcut. Free forever, no data collected.