Chrome Console Utilities: All 23 Tested on Chrome 154
Chrome console utilities are a set of helper functions — $0, $, $$, $x, copy(), debug(), monitor() and about fifteen more — that exist only inside the DevTools console. They are not part of JavaScript and not available to page scripts, but they turn the console into a much faster inspection tool than document.querySelectorAll and console.log ever will.
I ran every one of them against a small demo store page in Chrome 154.0.8037.93 (October 2026), partly through the DevTools UI and partly through the Chrome DevTools Protocol with the console's command-line API switched on, so each result below is something I watched happen. A few behave differently from what most tutorials claim, and those gotchas are the reason this page exists.
What Chrome Console Utilities Are (and Where They Work)
The Console Utilities API is a layer DevTools injects only when it evaluates what you type. Two facts follow from that, and I verified both:
- Page scripts cannot see them. Evaluated as page code,
typeof $$returned"undefined". Typed into the console on the same page, it returned"function". Do not ship code that depends on them. - The page can shadow them. I added
window.$ = s => "jquery-like:" + sto the page, then ran$(".price")in the console. It returned"jquery-like:.price". Any site with jQuery loaded behaves this way, which is why$sometimes returns a jQuery object instead of an element.$$and$xare rarely shadowed, so they are the safer habit.
Everything else on this page assumes you typed the command into the Console panel (Cmd+Option+J on Mac, Ctrl+Shift+J on Windows and Linux).
The Selection Utilities: $0, $, $$ and $x
These four are why most people learn the console utilities at all.
$0 to $4 — selection history. $0 is whatever is selected in the Elements panel; $1 to $4 are the previous four selections. I selected three product headings in order — keyboard, hub, monitor arm — and got $0 → "Monitor arm", $1 → "USB-C hub", $2 → "Mechanical keyboard". $3 returned undefined because there was no fourth selection yet. The history is a stack, most recent first, so "the thing I clicked before this one" is always $1.
$(selector, startNode) — shorthand for querySelector, returning the first match. The optional second argument scopes the search: $$("h2", $(".card:nth-child(4)")) returned exactly one heading, the one inside the fourth card.
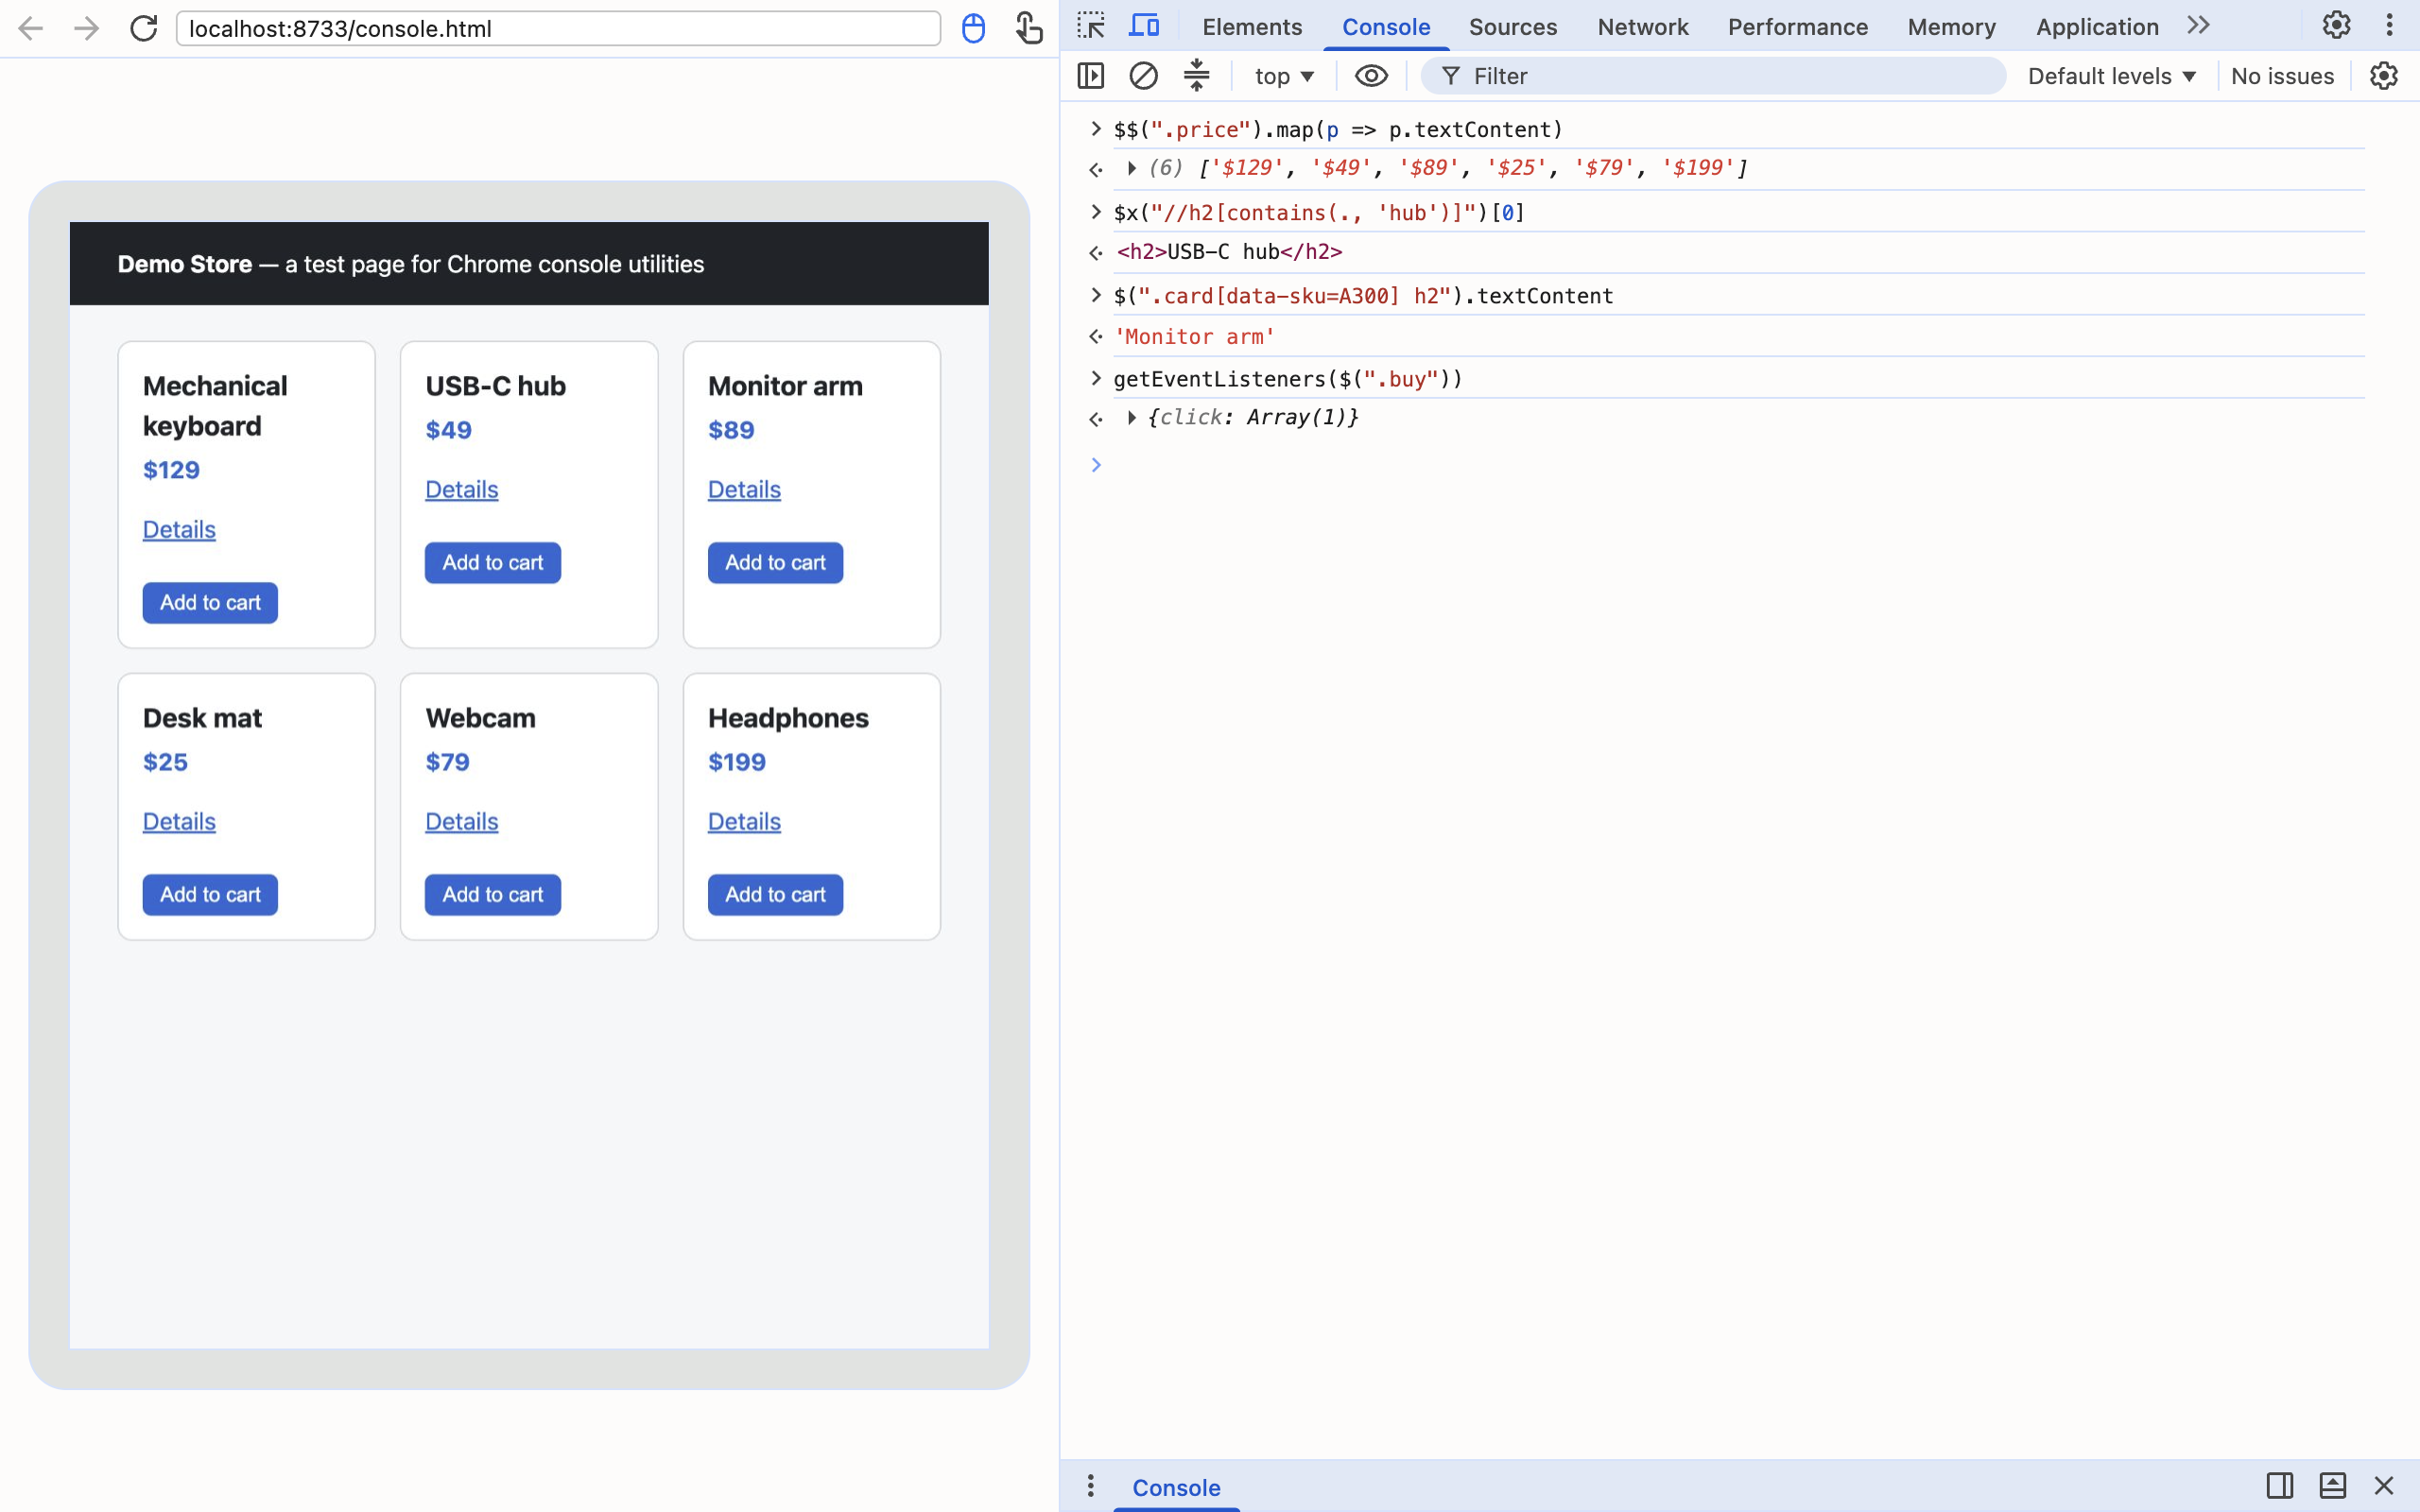
$$(selector, startNode) — shorthand for querySelectorAll, with one upgrade that matters: it returns a real Array. Array.isArray($$(".price")) was true, and $$(".price").map(p => p.textContent) gave me all six prices in one line. The same .map on document.querySelectorAll(".price") is undefined, because a NodeList has no map. That single difference removes the Array.from() you would otherwise wrap around every query.
$x(xpath, startNode) — evaluates XPath, which can do what CSS selectors cannot: match on text. $x("//h2[contains(., 'hub')]") returned the "USB-C hub" heading. It also handles XPath functions that return values instead of nodes: $x("count(//button)") returned the number 6.
copy() and $_: Getting Data Out of the Page
copy(value) puts any value on your clipboard. Strings are copied as-is, objects as formatted JSON. I ran copy($$("a").map(a => a.href).join("\n")) and the clipboard held the six product URLs, one per line — every one still carrying its ?utm_source=demo parameter. (If tracking parameters on copied links annoy you, copying clean URLs without tracking covers that problem directly.)
The gotcha: copy() does not touch the clipboard itself. When I evaluated it over the DevTools Protocol without the DevTools window attached, the call returned normally and the clipboard was unchanged — what actually came back was an "inspect" request with a copyToClipboard hint, addressed to the DevTools front end. So copy() works in the console, and silently does nothing from Puppeteer or other automation that evaluates code with the command-line API enabled.
$_ is the value of the last expression you evaluated. 6 * 7 then $_ + 1 gave 43. In the screenshot below, $$("a").length returned 6 and $_ * 2 returned 12. It saves retyping long expressions when you want to keep working with a result.
Watching Code Run: monitor(), debug() and getEventListeners()
These are the Chrome console utilities I reach for when I do not own the code and cannot add a console.log.
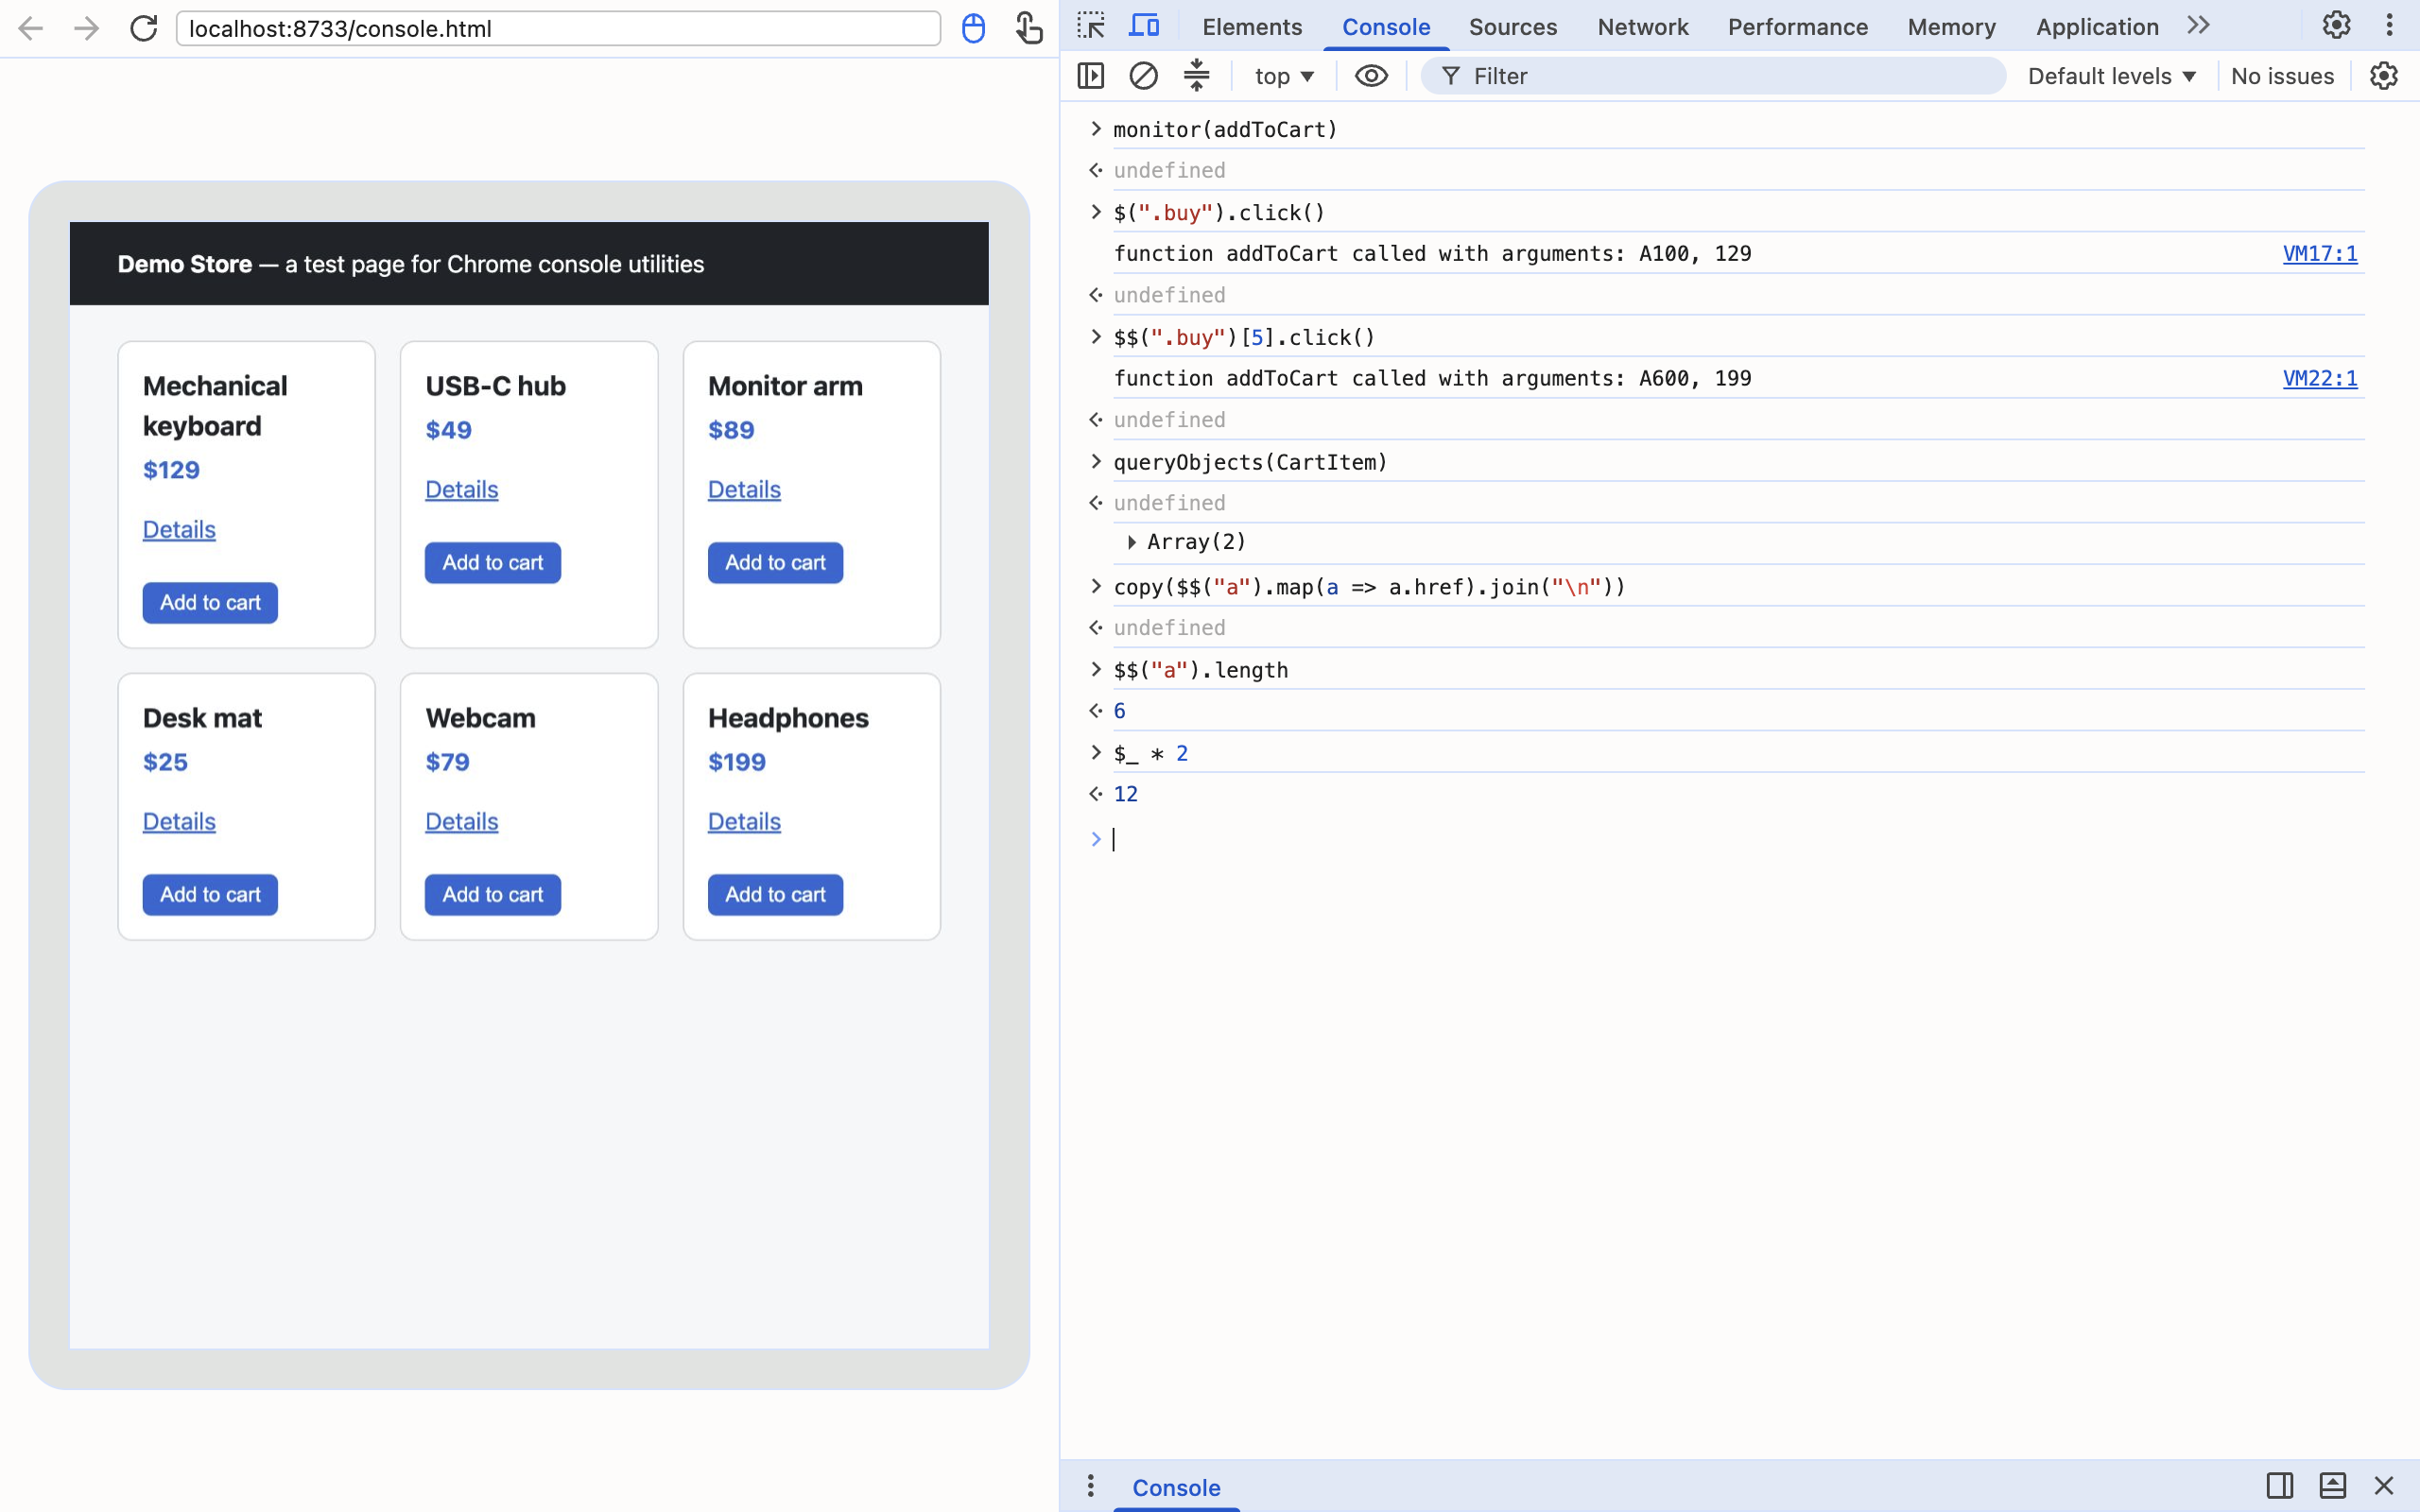
monitor(fn) / unmonitor(fn) log every call to a function with its arguments. After monitor(addToCart), clicking the first and last "Add to cart" buttons printed function addToCart called with arguments: A100, 129 and ... A600, 199. No source edits, no breakpoints. unmonitor(addToCart) stopped the logging immediately.
debug(fn) / undebug(fn) go one step further: the next call pauses the debugger on the function's first line. After debug(addToCart), the very next call paused with the reason debugCommand. After undebug(addToCart), calls ran straight through. This is the fastest way to set a breakpoint in a function when you know its name but not which bundled file it lives in.
getEventListeners(target) returns the listeners attached to an element, grouped by event type. On an "Add to cart" button it returned {click: Array(1)}; on window it returned one resize listener. Each entry holds the listener function itself, plus flags such as once and passive.
monitorEvents(target, types) / unmonitorEvents(target) log events as they fire. The second argument accepts a single event name, an array such as ["click", "keydown"], or a group name. I tested two groups: "mouse" logged both a mousedown and a click, and "key" logged a keyup. One detail I did not expect: in Chrome 154 a scripted .click() logs as a PointerEvent, not a MouseEvent.
Inspecting Objects: queryObjects(), inspect(), dir() and table()
queryObjects(Constructor) returns every live object created by a constructor — a memory-debugging tool hiding in the console. After adding two items to the cart, queryObjects(CartItem) printed Array(2). Note the output order in the screenshot above: the call itself evaluates to undefined, and the array arrives as a separate log line a moment later.
inspect(object) jumps to the right panel for a value. inspect($("#products")) switched DevTools to the Elements panel with that node selected, which also makes it the new $0.
dir(object) and dirxml(object) are the console's console.dir and console.dirxml: dir shows a DOM element as a JavaScript object with all its properties, dirxml shows it as markup.
table(data, columns) renders an array of objects as a sortable table. This one-liner produced the table below:
table($$(".card").map(c => ({
  sku: c.dataset.sku,
  name: c.querySelector("h2").textContent,
  price: c.querySelector(".price").textContent,
})))
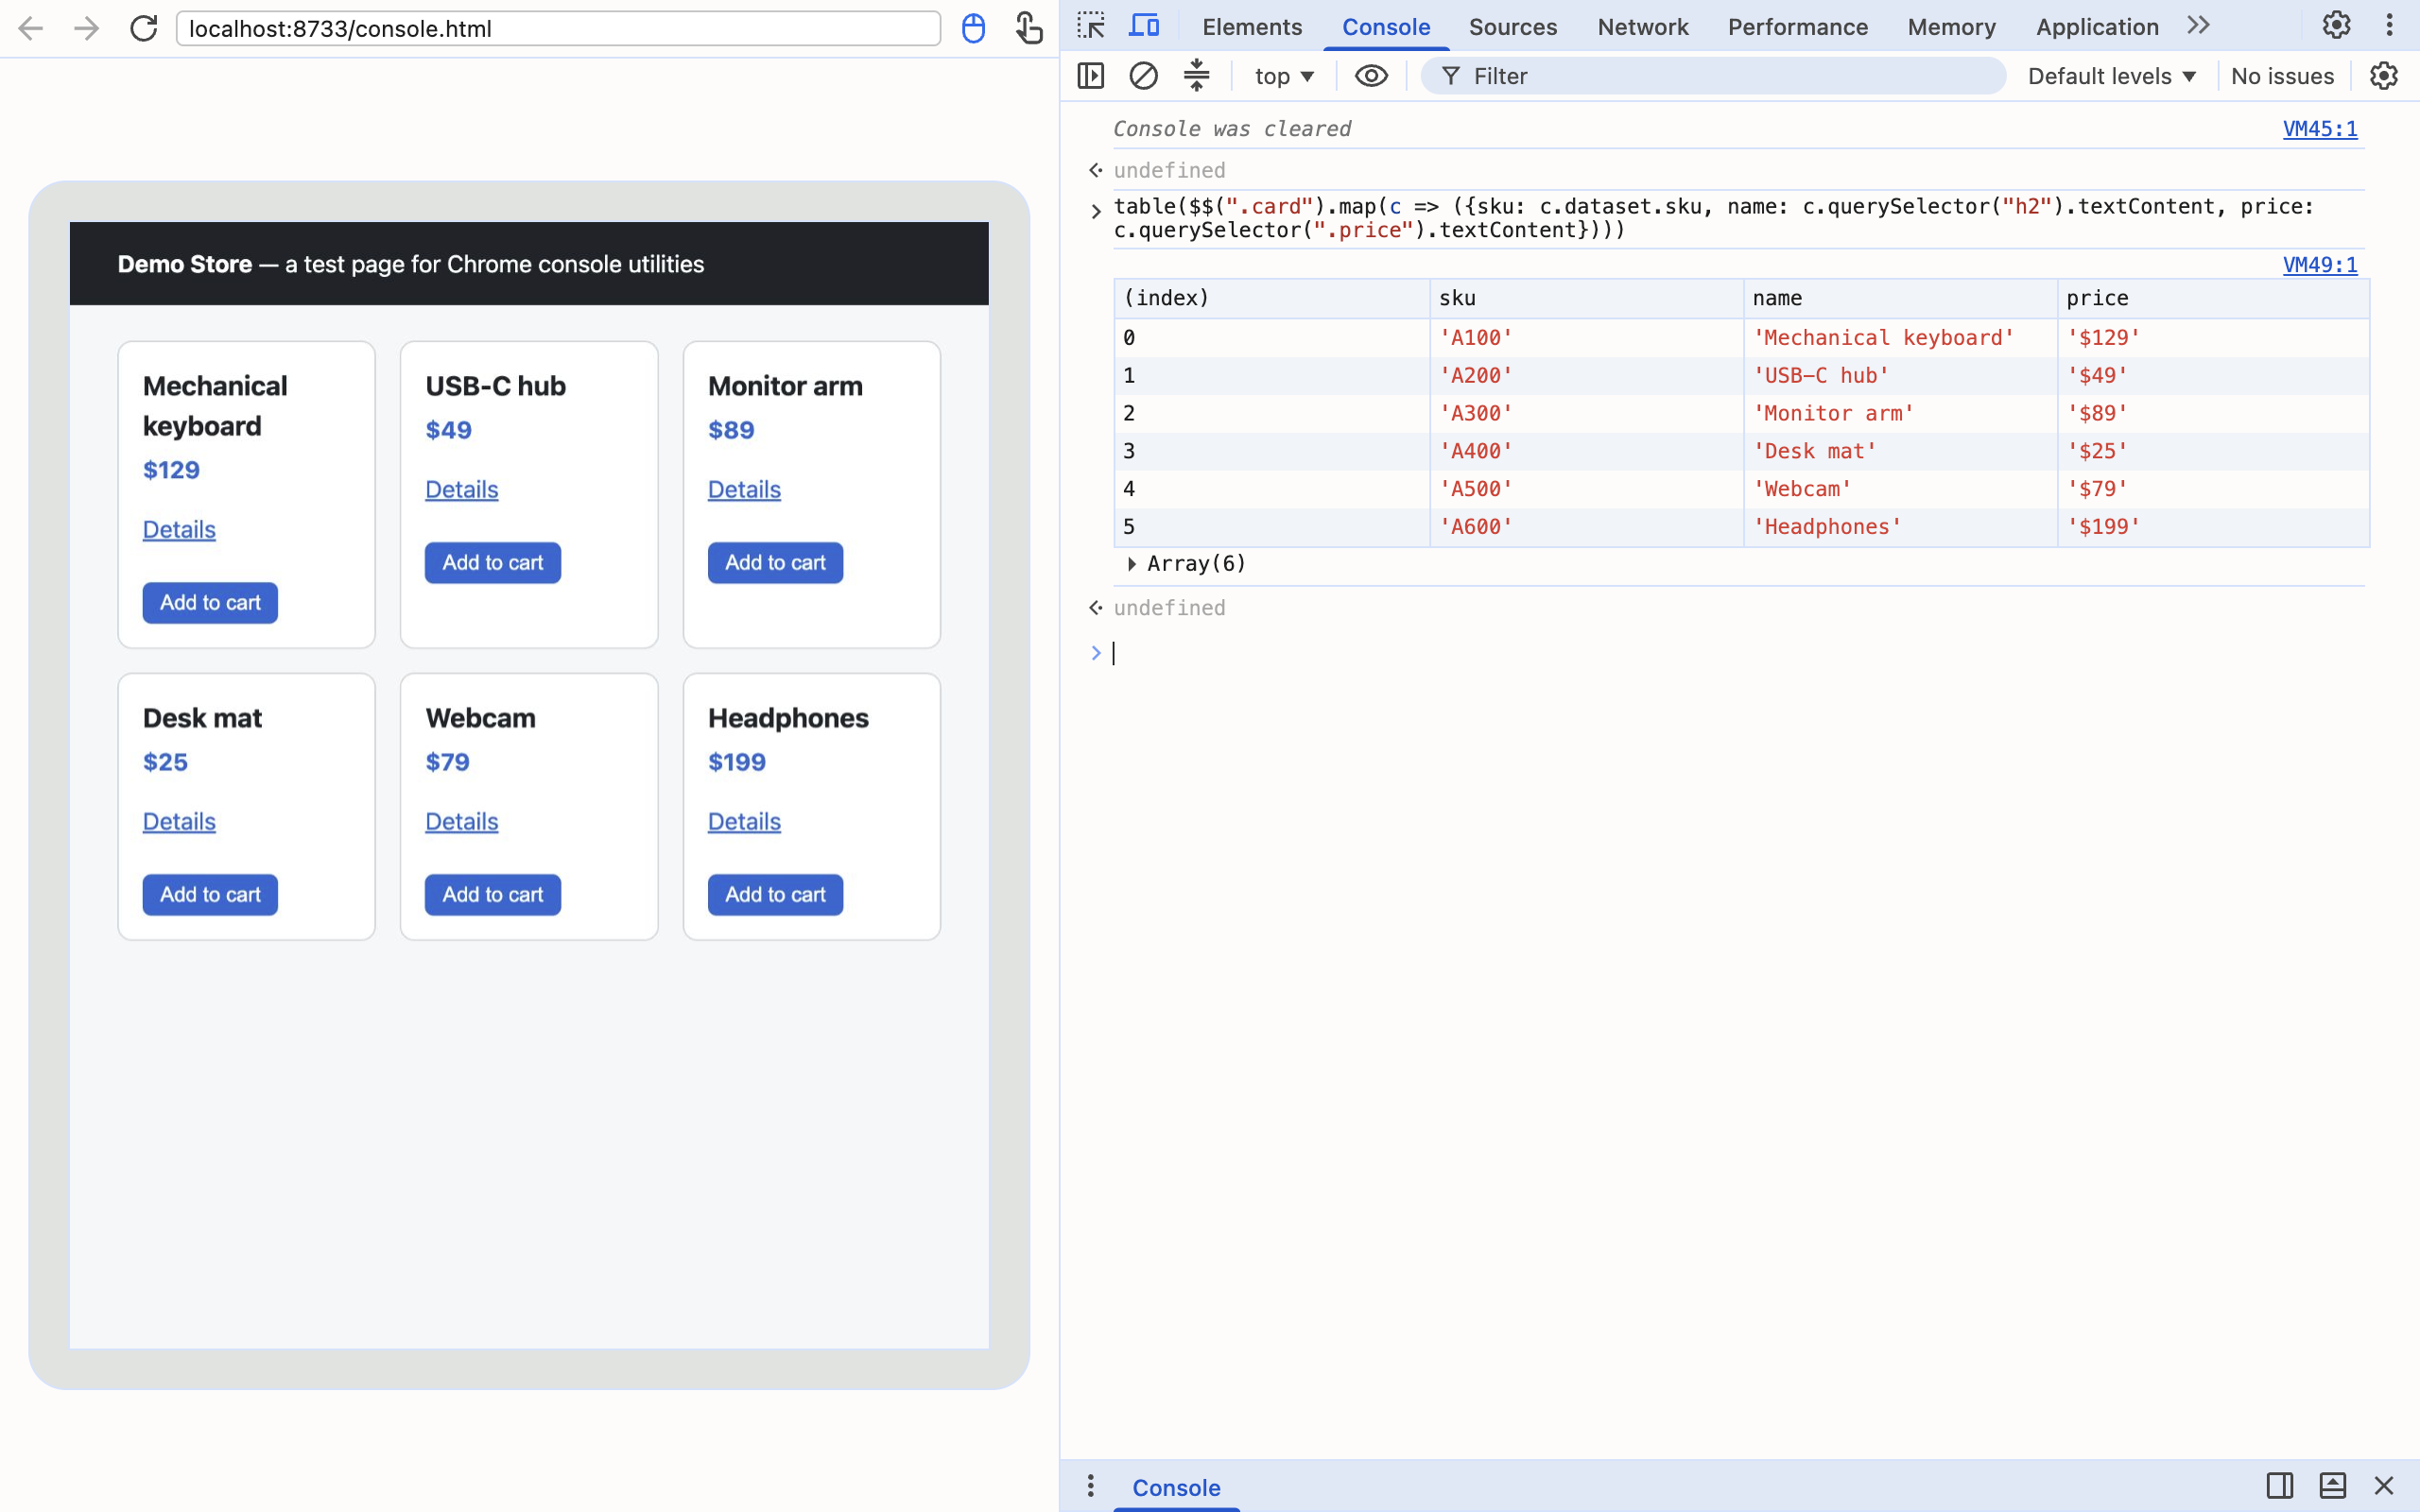
Combined with $$, table() is a two-second page scraper for anything visible on screen.
The Rest: keys(), values(), clear() and profile()
keys(object) and values(object) return an object's property names and values as arrays: keys({a: 1, b: 2}) gave ["a", "b"], values() gave [1, 2]. They are shorter versions of Object.keys and Object.values.
clear() wipes the console and leaves a "Console was cleared" line.
profile(name) and profileEnd(name) start and stop a named JavaScript CPU profile around whatever runs in between. I wrapped a loop of 100,000 addToCart calls with profile("checkout") and profileEnd("checkout"), and DevTools recorded a profile titled "checkout". Useful when you want a profile of one specific operation instead of a whole page recording.
Every Chrome Console Utility, Tested
Here is the full list, with what each returned in my Chrome 154 test:
| Utility | What it does | Verified result on Chrome 154 |
|---|---|---|
$_ | Last evaluated value | 6*7 then $_ + 1 → 43 |
$0 – $4 | Current and previous four Elements selections | $0 most recent, $3 undefined after 3 selections |
$(sel, node) | First match (querySelector) | Returns page's $ if the site defines one |
$$(sel, node) | All matches as a real Array | Array.isArray → true, .map works |
$x(path, node) | XPath query | count(//button) → 6 |
clear() | Clears the console | "Console was cleared" |
copy(value) | Copies to clipboard | Works in DevTools only, not over raw CDP |
debug(fn) | Pause on next call | Paused, reason debugCommand |
undebug(fn) | Remove debug() | Call ran without pausing |
dir(obj) | Object view of a value | Logged the h2 as an object |
dirxml(obj) | Markup view of a node | Logged the h2 as XML |
getEventListeners(obj) | Listeners by event type | Button → {click: Array(1)} |
inspect(obj) | Reveal in Elements or Sources | Switched to Elements, node selected |
keys(obj) | Property names | ["a", "b"] |
values(obj) | Property values | [1, 2] |
monitor(fn) | Log each call with arguments | "called with arguments: A100, 129" |
unmonitor(fn) | Stop monitor() | Logging stopped |
monitorEvents(obj, types) | Log events | "mouse" and "key" groups both worked |
unmonitorEvents(obj) | Stop event logging | No further output |
profile(name) | Start a CPU profile | Profile "checkout" started |
profileEnd(name) | Stop the profile | Profile "checkout" recorded |
queryObjects(Ctor) | Live instances of a class | CartItem → Array(2) |
table(data) | Tabular output | Six-row product table |
Five Habits That Make the Console Utilities Pay Off
- Use
$$by default, even for single elements — the Array return type means you never wrap anything inArray.from. - Pick an element in Elements, then work on
$0instead of writing a selector. Styling questions like "why is this tooltip hidden" usually start there, and for states that only exist on hover or focus, forcing element state in DevTools keeps them visible while you poke at them. - Reach for
monitor()before breakpoints. A log of arguments is often all you needed, and it does not stop the page. - Use
debug()when you know the function name but not the file; it beats searching minified bundles. - End data hunts with
copy().copy(JSON.stringify(state, null, 2))gets any object into a ticket or chat thread in one step.
For the broader toolbox around the console — snippets, overrides, conditional breakpoints — see the Chrome DevTools tips and tricks guide, and the Chrome developer tools shortcuts list for the keyboard side.
Frequently Asked Questions
What does $0 mean in the Chrome console? $0 is the element currently selected in the Elements panel. $1 to $4 are the four previous selections, so $1 is the element you selected before the current one. If you have selected fewer elements, the higher slots return undefined.
What is the difference between $$ and document.querySelectorAll?
$$ returns a real JavaScript Array, so map, filter and reduce work directly. document.querySelectorAll returns a NodeList, which has forEach but no map. In Chrome 154, $$(".price").constructor.name returned Array.
Why does $ behave differently on some sites?
If the page defines its own $ (jQuery and many older libraries do), the page version wins over the console utility. In my test, after the page set window.$, typing $(".price") in the console called the page function instead of querySelector.
Can I use console utilities like $$ or copy() in my own scripts?
No. They exist only when code is evaluated from the DevTools console. A page script that checks typeof $$ gets undefined. Use document.querySelectorAll or navigator.clipboard in real code.
Why does copy() not work from Puppeteer or a CDP script? copy() does not write to the clipboard itself. It asks the DevTools front end to do the copy, so it only works when DevTools is attached. Evaluated over raw CDP without DevTools, the call returns but the clipboard is unchanged.
How do I pause whenever a function is called without editing the code?
Run debug(functionName) in the console. The next call to that function pauses in the Sources panel as if it had a breakpoint on its first line. Run undebug(functionName) to remove it.
copy() is the console's answer to "get this out of the page and into my clipboard". For the most common thing developers copy all day — the URL of the tab they are on — there is no console needed: Ctrl+Shift+C copies the current tab's URL with one keystroke, works on any page, and collects no data.
Try Ctrl+Shift+C
Copy any URL with one keyboard shortcut. Free forever, no data collected.